Capturing criteria to purchase new devices
or fix currently owned devices
We have been involved in multiple situations where individuals lost their jobs, or a lot of credibility because they bought color output devices that did not perform to their management's/customer's expectations. We have developed a straight forward way to benchmark any output device and understand what it’s “normal" variation and accuracy in order to implement the processes necessary to make the device meet desired expectations.
ChromaChecker will not only assess the "normal" variation and accuracy of any output device, but it can fix the accuracy by iterating new G7 tone curves in order to bring a device back into compliance with the desired target.
Unlike any other system on the market today, ChromaChecker can assess a device's performance based on its ability to meet a designated conformance schema. ChromaChecker will also quantify which device track is the closest to the desired reference condition. This is done with a single E-Factor number, based on the delta E (00) at the 95th percentile, providing an excellent indication of how close the colors of an image or page matches the reference. (See our TAGA 2017 papers on Color Matching and Shared Color Appearance for more info)
Three Part Benchmarking Form
We have developed a three part PDF form which is designed to provide measurement data which, when uploaded to ChromaChecker, will populate information for eight different benchmarks for an output device. If you would like these test forms to print on your devices, please e-mail david@chromachecker.com
| Eight benchmarks cover: | |
|
1. Within Page Uniformity |
Precision |
|
2. Within Page uniformity using M-Score |
Precision |
|
3. Repeatability through a 1000 page print run, including page uniformity within 1000 page print run |
Precision |
|
4. Reproducibility between multiple days |
Precision |
|
5. Shared Appearance between multiple devices |
Accuracy |
|
6. Gamut Volume numeric metric along with percentage of PMS colors within 2 delta E of the devices gamut |
Accuracy |
|
7. Accuracy of the devices ability to match GRACoL |
Accuracy |
| 8. Addressability, determining the marking engines resolution and contract capabilities compared to other devices in category | |
The Benefits of Benchmarking your devices:
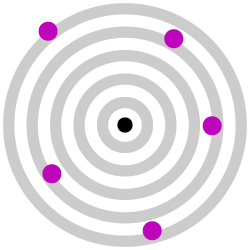
1. Most companies do not understand how their output devices manufacture color, related to precision and accuracy. Yet, it is imperative to understand these two attributes in order to troubleshoot and fix your color process if it is not meeting expectations. Most companies print any way, any day, and they have very little precision or accuracy. Their customers don’t complain if their expectations are not met, they just go somewhere else (like when you have a bad meal at a restaurant- you don’t go back). This group is represented by the first bulls eye.
 |
 |
 |
 |
| LOW ACCURACY LOW PRECISION |
LOW ACCURACY HIGH PRECISION |
HIGH ACCURACY LOW PRECISION |
HIGH ACCURACY HIGH PRECISION |
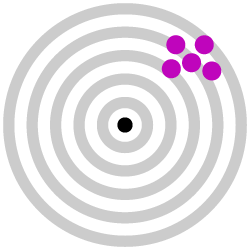
2. Some printers have better control of their output devices. They may use scanning spectrophotometers to assess their output, which provides consistency but not accuracy to the process. This is depicted in the second bulls eye.
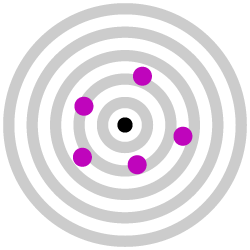
3. Some printers don’t have scanners, but do update their profiles or G7 tone curves regularly. This group is represented by the third bulls eye, representing decent accuracy but not very good consistency.
4. The best printers have both consistency and accuracy and don't need to print jobs more than once. They are correct the first time, they know it, and they can prove it to their customers. These are the printers that make up less than 25% of the print industry and operate on 10% or greater gross profit margins on sales.
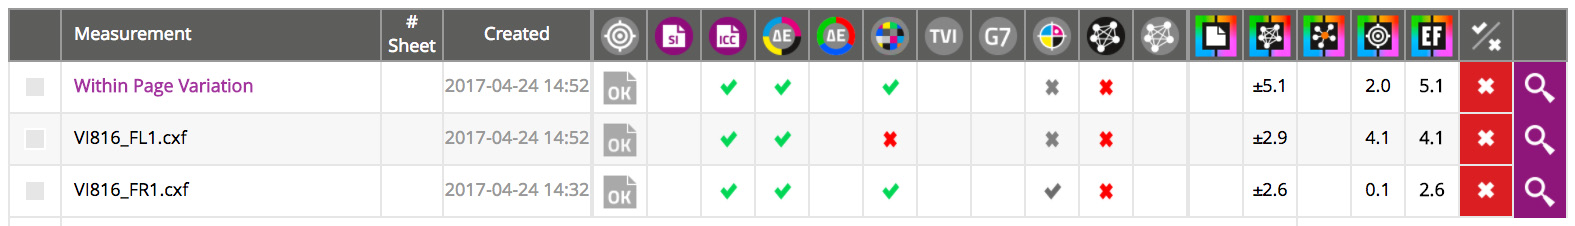
Benchmark #1- Within Page Uniformity
Variation within an imaging area using VI816 Target
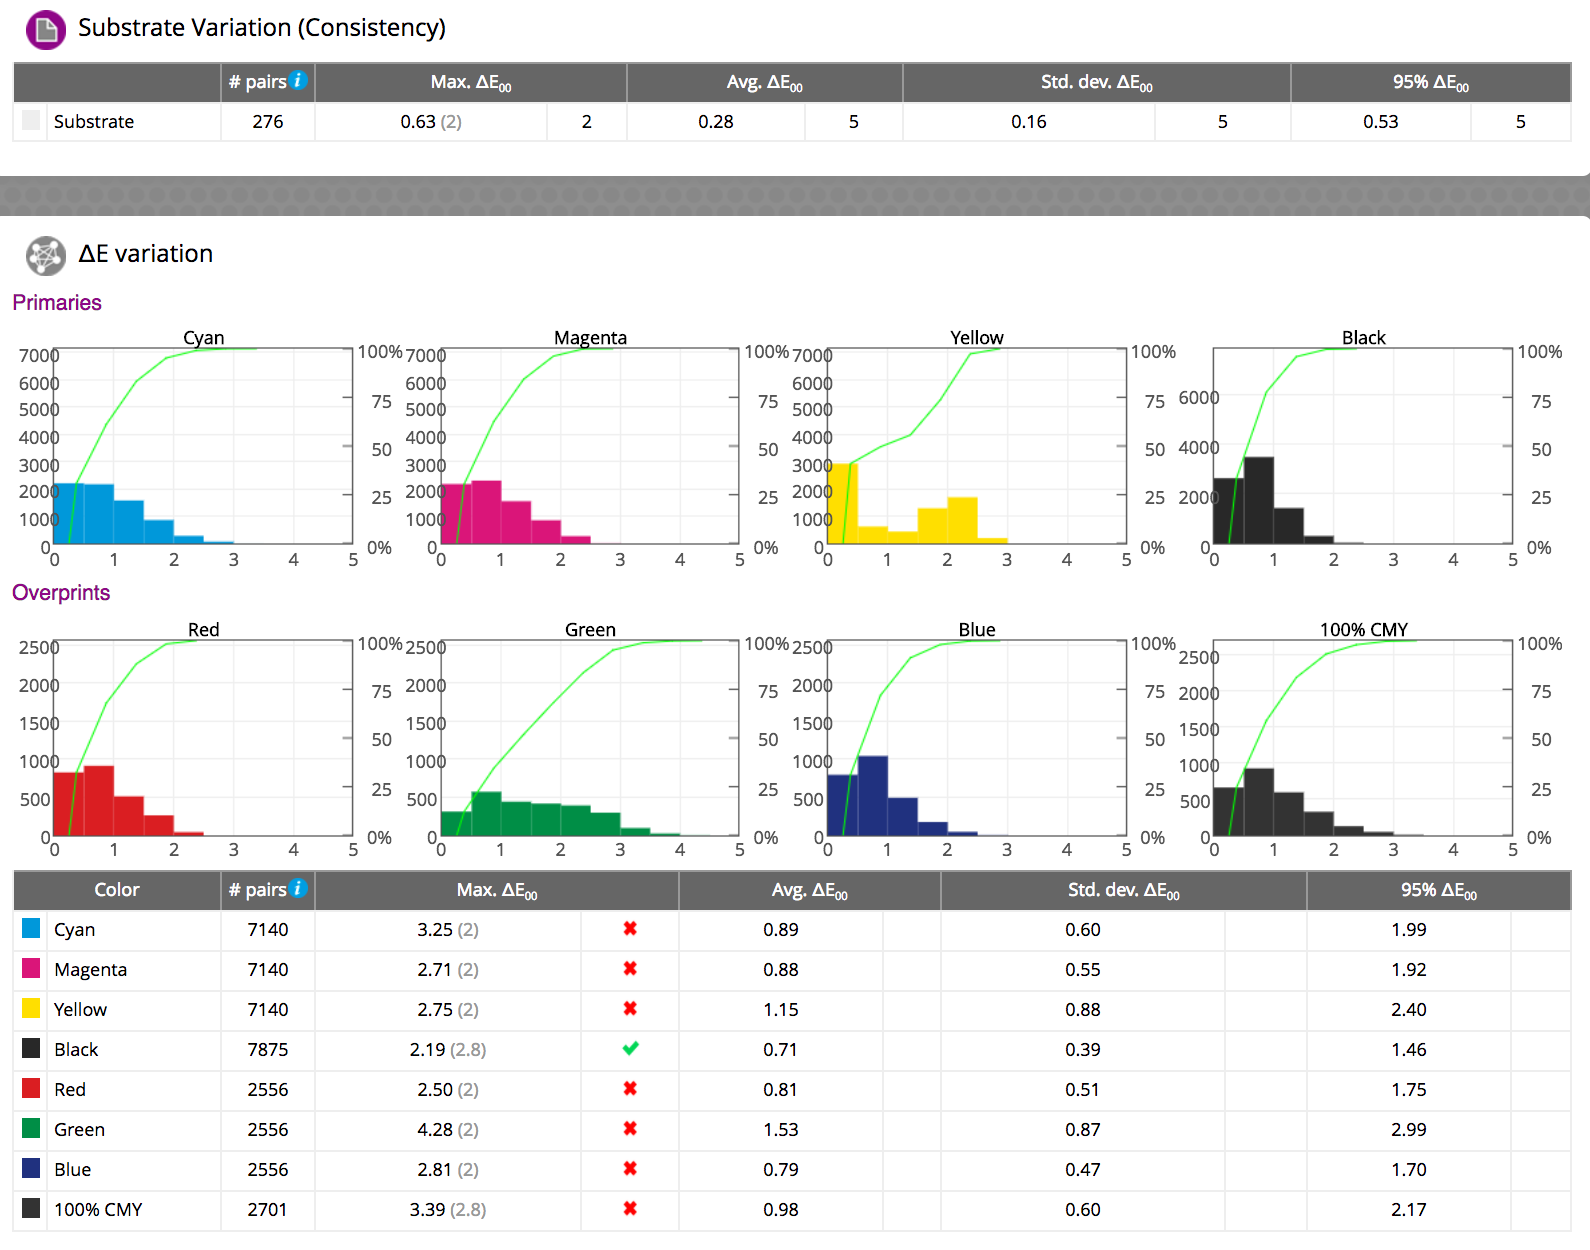
This benchmark assesses the output devices consistency when imaging the same CMYK builds in multiple locations throughout a page. We use the VI816 target for this assessment which has multiple patches of all the CMYK solids and tints, and G7 three color overprints.
| Here is an example of a printer that varies by 5 delta E CRF on the same page: | |
 |
|
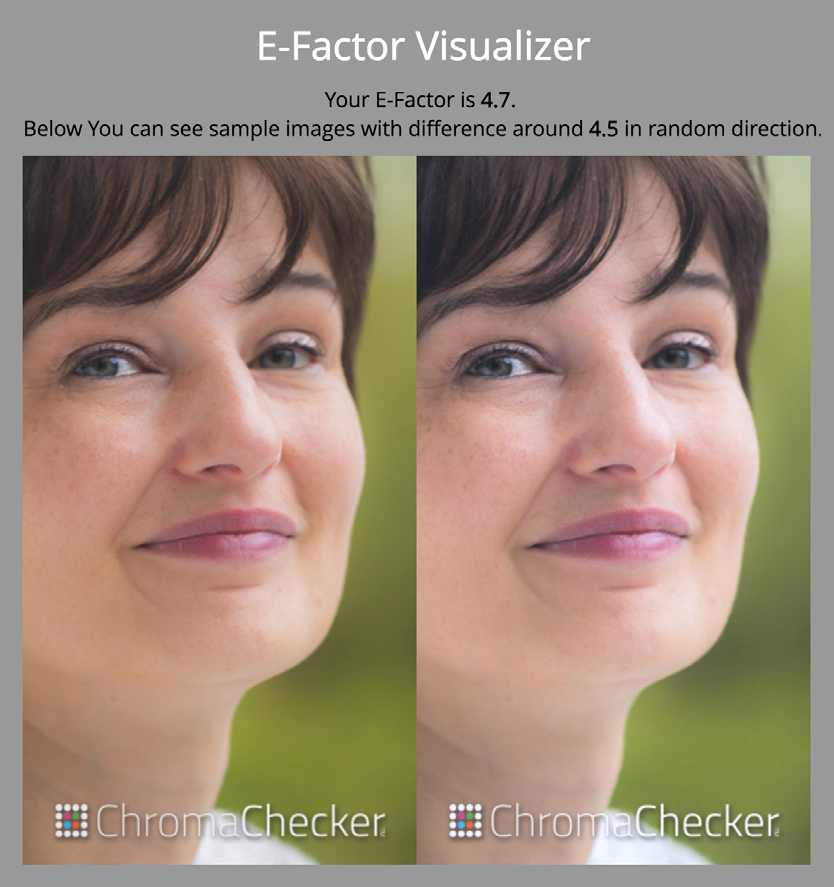
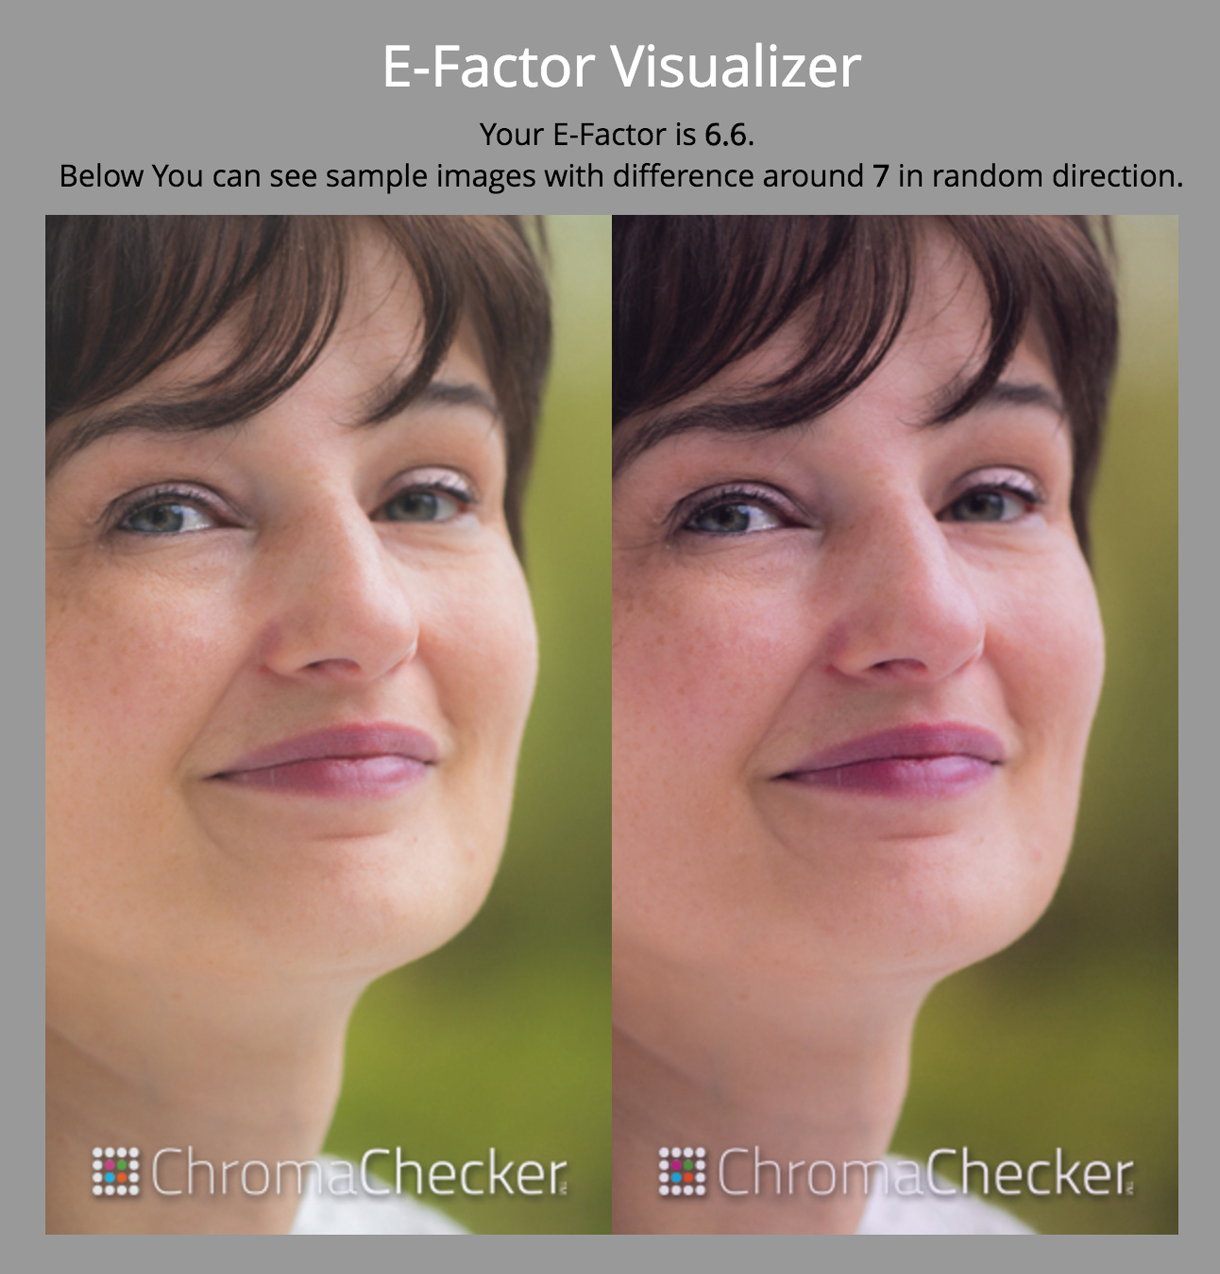
| Here is what a 5.1 E-Factor difference looks like: | This graphic shows the variation of the solids and overprints |
 |
 |
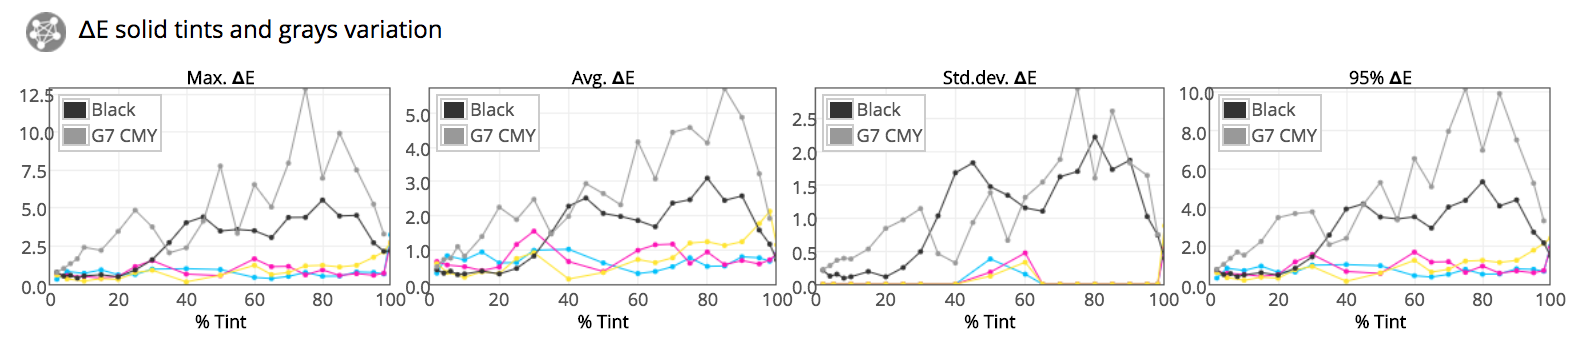
| The graphic below shows the variation of the tints within the same page on this device. Notice the CRF 95% is 5.1, Peak is 12.9 CRF | |
 |
|
Summary, if a device’s within page E-Factor uniformity is beyond your given expectations then there is no reason to conduct any other benchmark. Ideally the within page uniformities E-Factor for a given device should be no more than 30% of your desired E-Factor, which means, if you desire a manufacturing process with a 3 E-Factor, then the device should not have more than a 1 within page uniformity E-Factor.
Benchmark #2- Within Page Uniformity — M-Score
Variation within an imaging area using M-Score Target
This benchmark assesses the output devices consistency when imaging the same CMYK builds in multiple locations throughout a page. Three M-Score targets are required for this assessment which have three different CMYK tints covering the entire page. An M-Score of 70 is required to be a Certified Digital Press with different organization's certification schemas.
Here is an example of one M-Score target made up of repeating patchs of 20,15,15,15 builds, and the middle image is the actual measurement file from this device, and on the right is the relative color difference of this device due to the within page variation.
 |
 |
|
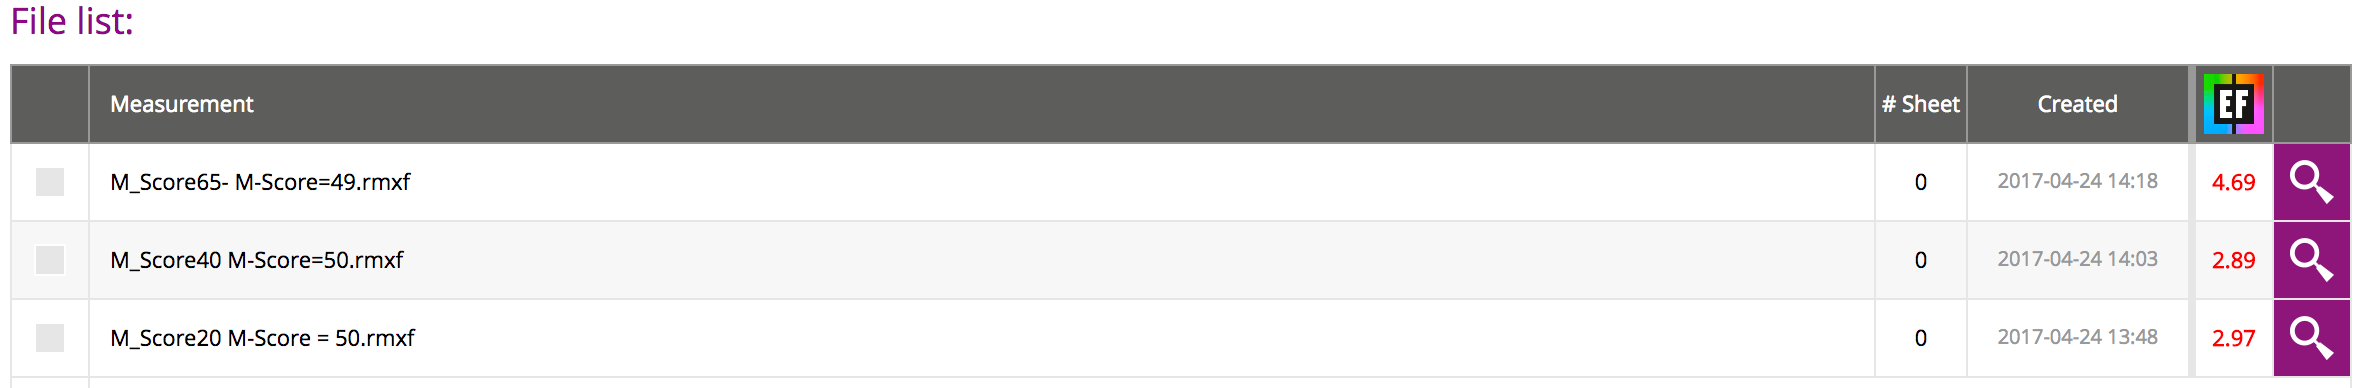
Following is the ChromaChecker line list of the three targets and the respective M-Scores and E-Factor values.
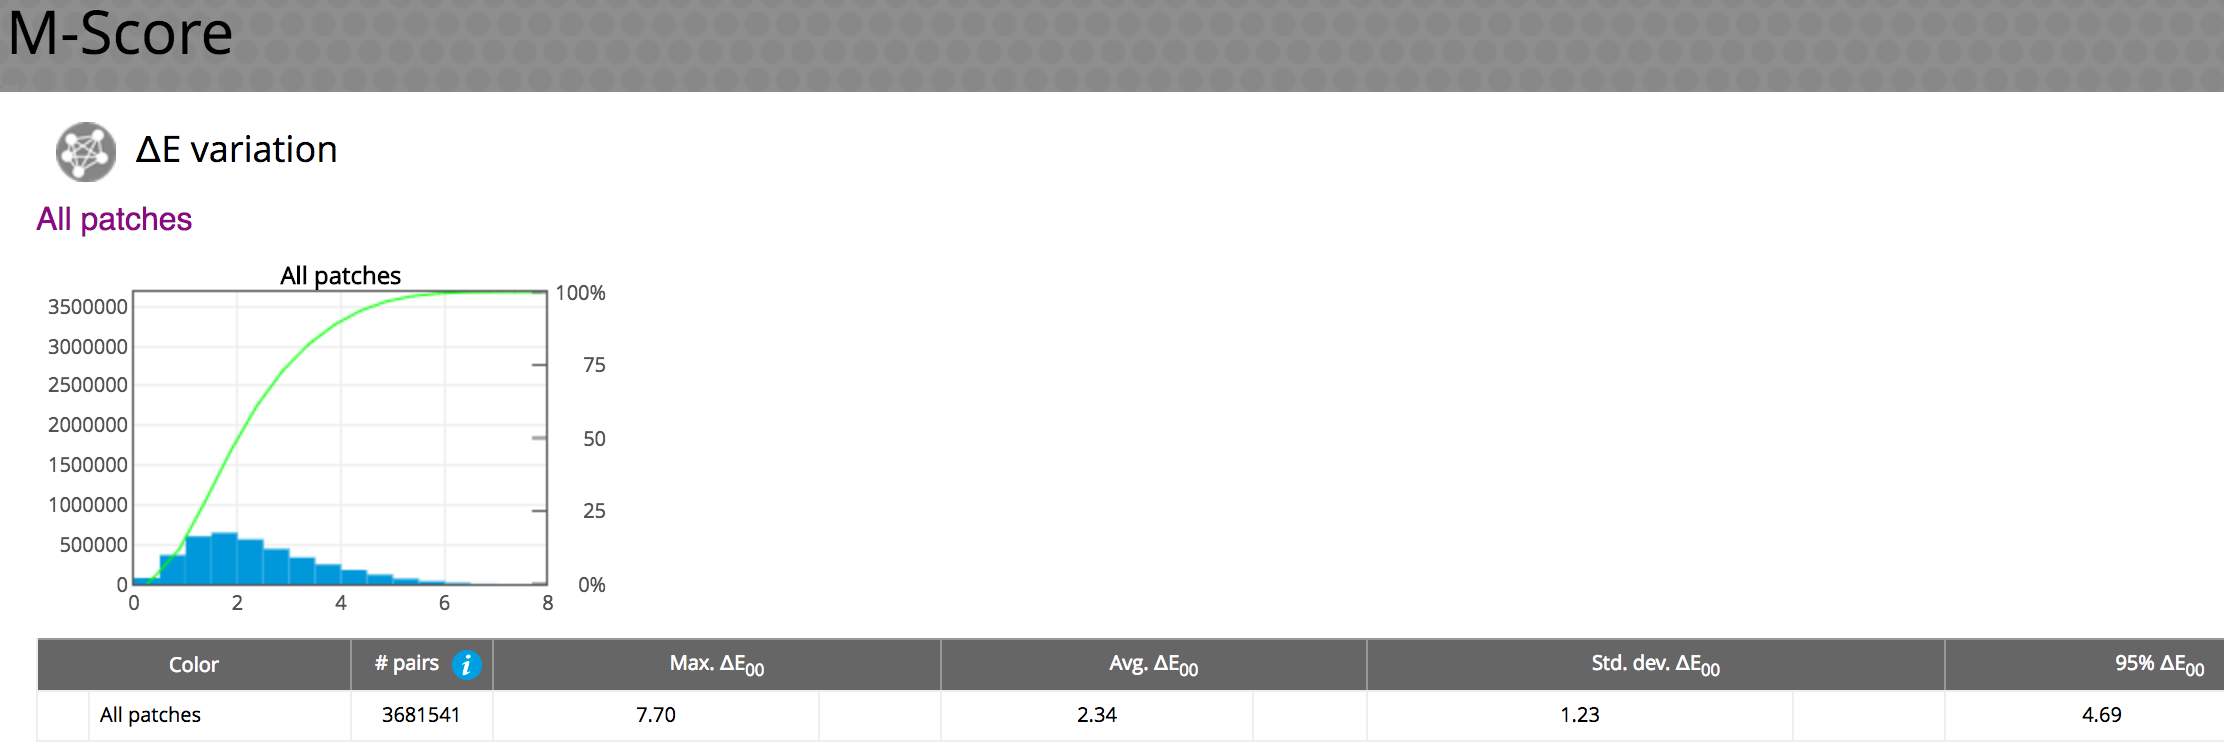
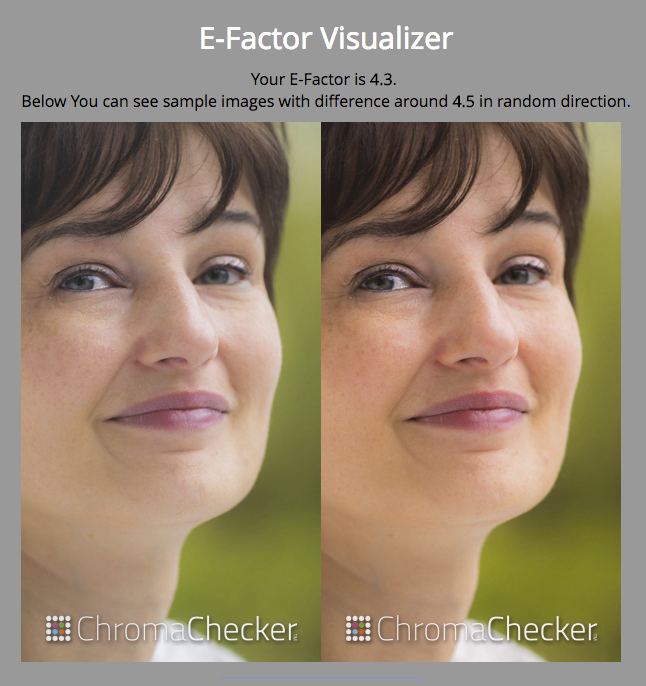
Next is the ChromaChecker detail of the top measurement, 65,50,50,50. Notice 3,681,000 paired comparisons were calculated to determine this value.
The M-Score is another way to assess an output devices within page uniformity, supported by using ChromaChecker.
Benchmark #3- Repeatability — through a 1000 sheet run
Within Page Variation – and Between Page Variation
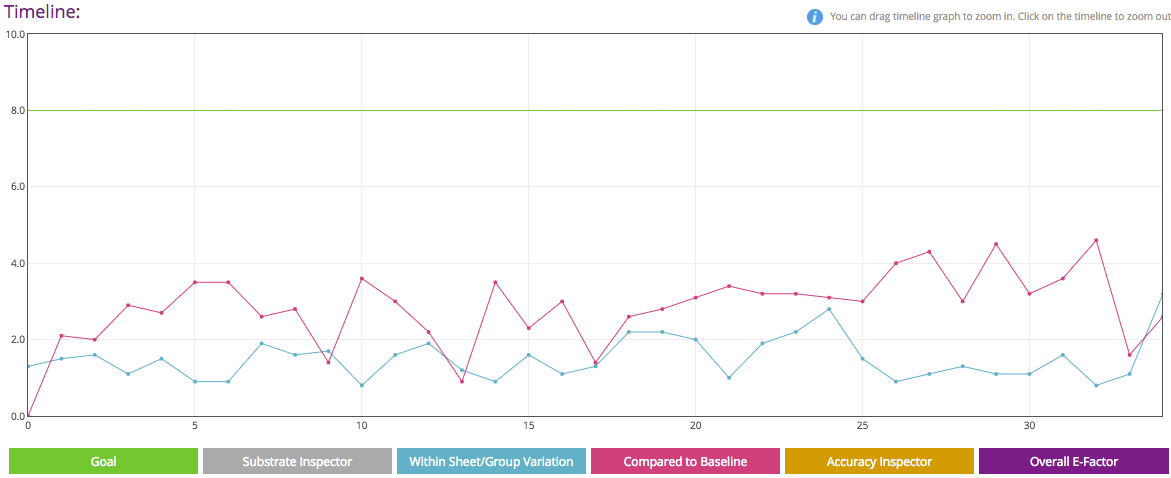
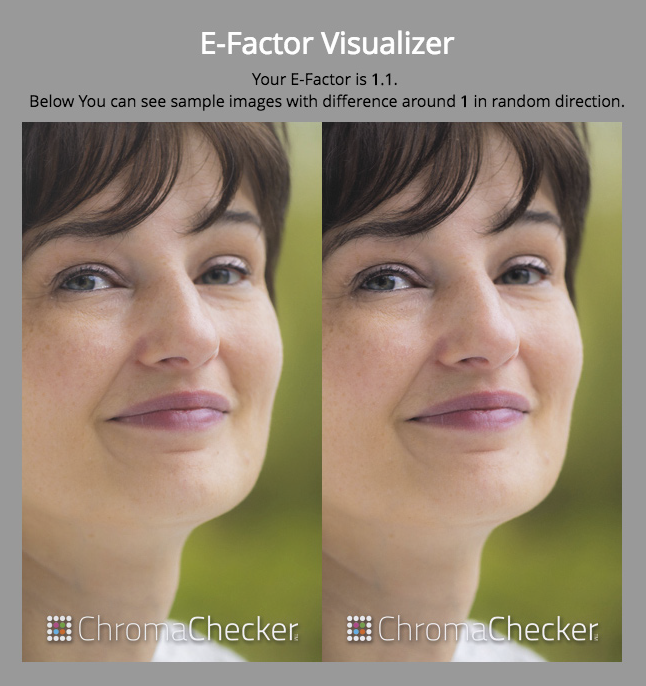
Below are two graphs representing two popular digital presses and how consistently they image color through a 1000 page print run. The red line represents the variation, in delta E CRF, from the first page to the 1000th page, in 50 page increments. The blue line represents the variation within each page through the one thousand page run. The woman’s picture represents the respective level of variation within each press.
 |
 |
 |
 |
Observations:
ChromaChecker can be used to assess all levels of color precision and accuracy related to any type of color reproduction process. When using ChromaChecker, you are able to evaluate the consistency of any output device and understand if it will meet your customer's needs. Almost a majority of customers (50%+) wouldn't accept the difference between the top two woman images, and yet this is how this press would process that very image through a one thousand page run. And, based on industry psychometric testing, 99% of the industry would accept the bottom sample variation within a print run.
Can your company afford to print jobs that customers will not accept and will not pay for? No company can afford this! This is the very reason 50% of printers make less than 2% profit margin on their sales, losing money daily, printing unacceptable, nonsalable goods. It is time to utilize ChromaChecker because it will track problems before they cost money and enable you to make good decisions related to your printing business.
Benchmark #4- Reproducability between multiple days
Between Job Variation from day to day
|
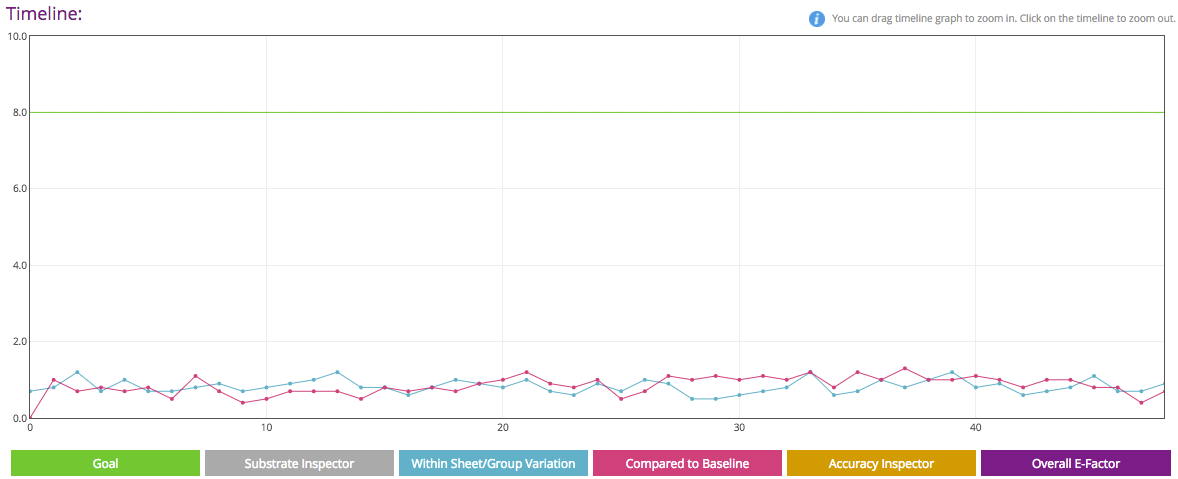
Obviously the reproducibility of a device is dependent on the maintenance and calibration procedures being implemented Below is a line graph showing the reproducibility of a regularly calibrated digital press over the course of 40 days. |
Below is an image representing the relative variation of the press to the baseline which graphically shows the difference of how this press is printing compared to when the device was last ICC Profiled or the last time a G7 Tone curve was generated. |
 |
 |
Knowing the variation between days allows an operator to stay ahead of the digital manufacturing process to ensure the prints meet customer expectations. Take the ChromaChecker Digital Press Operators course (KS- can we put the link to the course here?) to understand how to know when to recalibrate versus when to reprofile.
Benchmark #5- Reproducibility between output devices
Four digital presses over multiple months
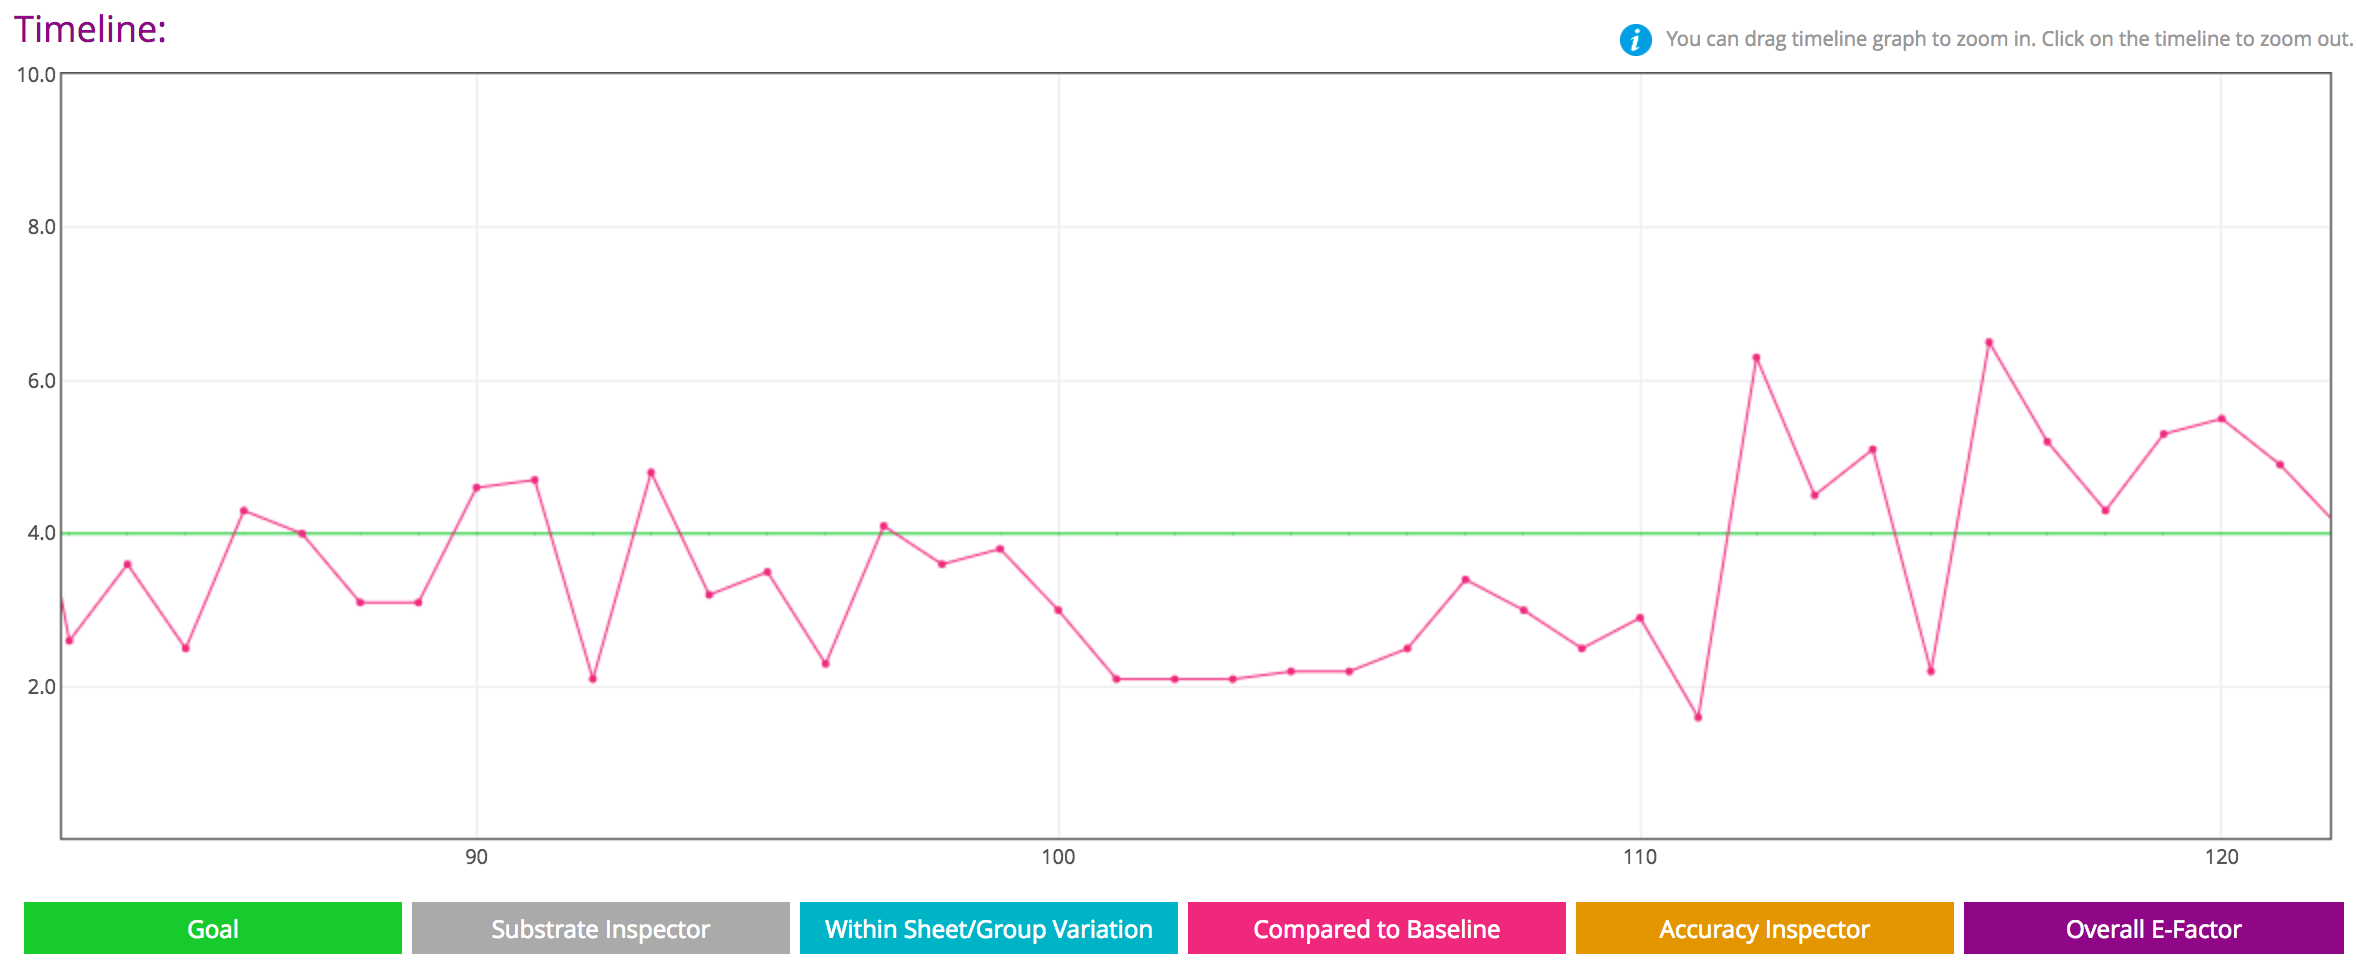
Below is a line graph showing the reproducibility of multiple digital presses over multiple years:
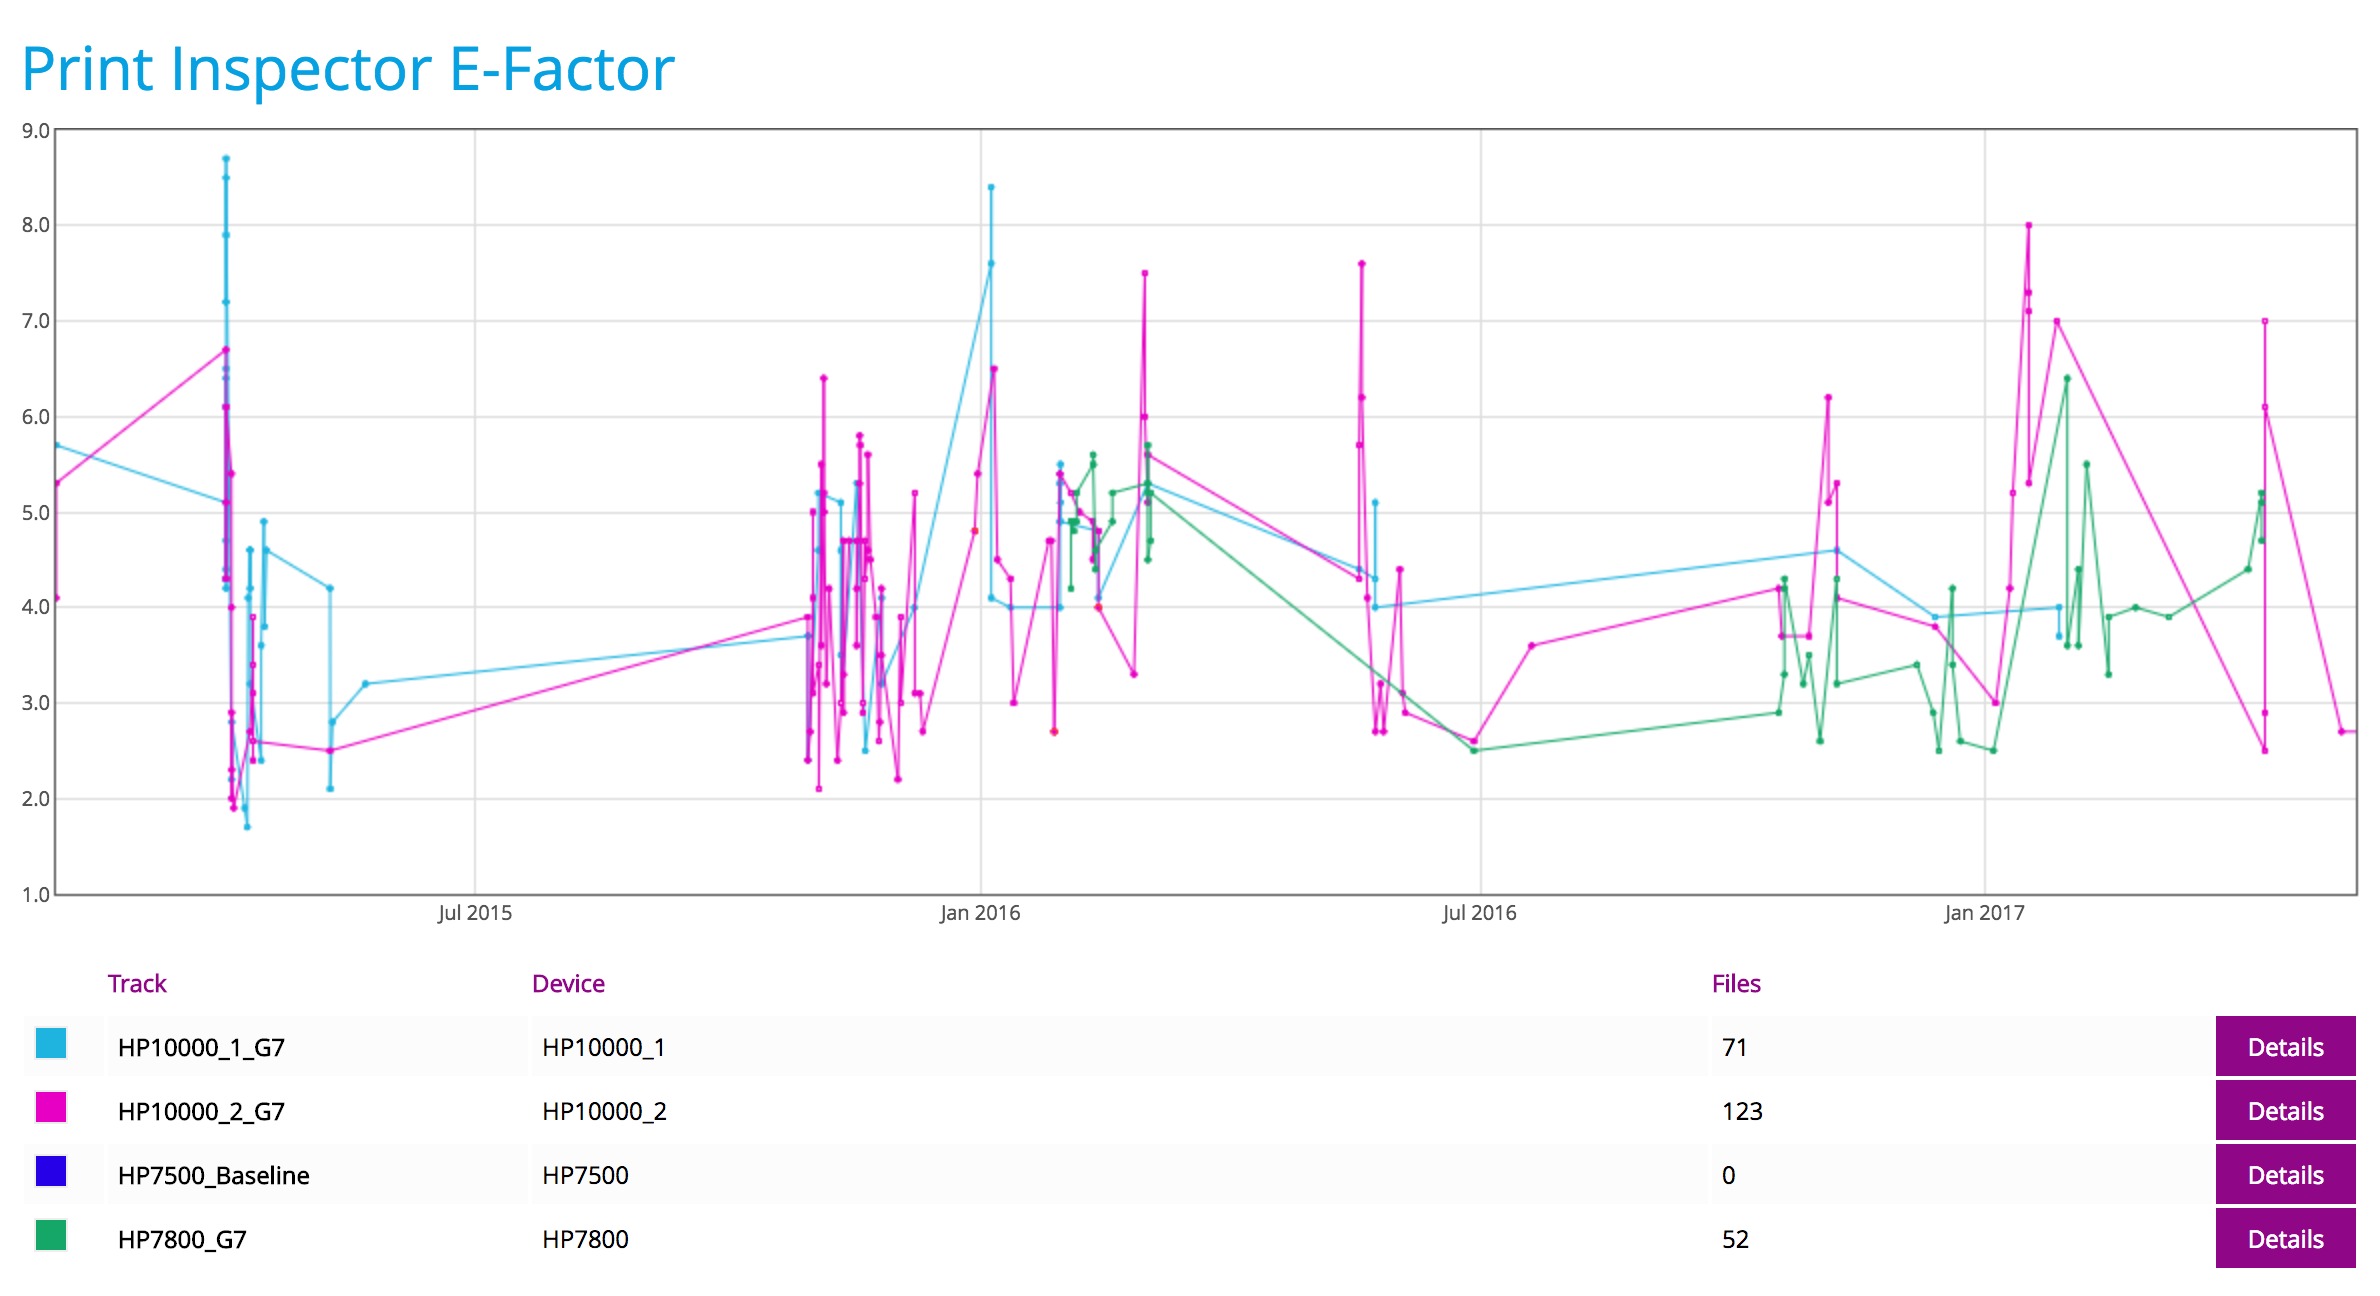
Obviously, the reproducibility of any digital device is dependent on the maintenance and calibration procedures that are implemented with that press. This process, of understanding what “normal” variation is, is critical to being able to use the device in manufacturing prints that meet customer expectations. The following graph helps show what the normal variation is for these devices.
This matrix displays how differently the four different presses reproduce color compared to one another over the last five averaged prints.
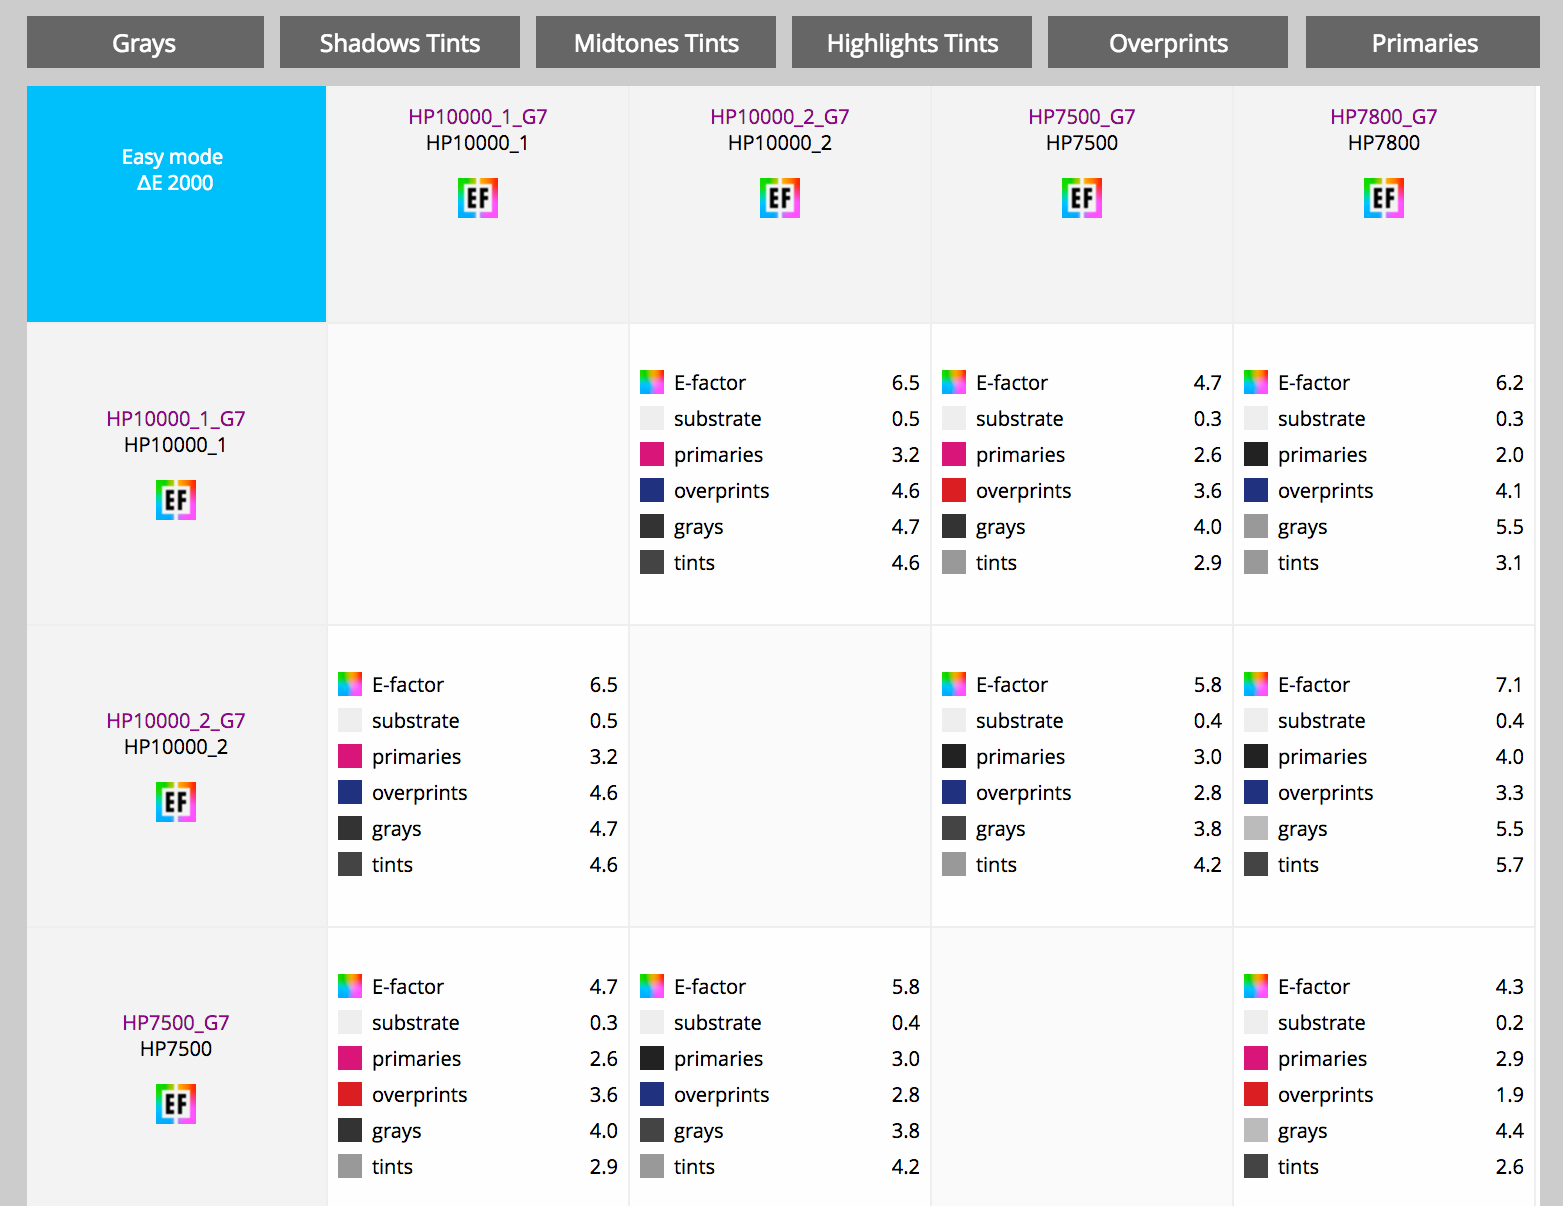
Notice the average difference between these digital presses is approximately 5.8 E-Factor, which is important to know based on your customers expecations. The majority of the differences are in the three color overprints. Tightening the G7 tolerances will reduce deviation.
Benchmark #6- Gamut Volume of Digital Press
Using the IT8 Target to assess gamut volume and Pantone coverage
Calculating the gamut volume of a device in units provides an estimate of how large a devices gamut is, and allows us to compare the relative gamut to different devices. Substrate has a huge influence on device gamut so it is critical to ensure similar substrates are being used when comparing different output devices, one to another.
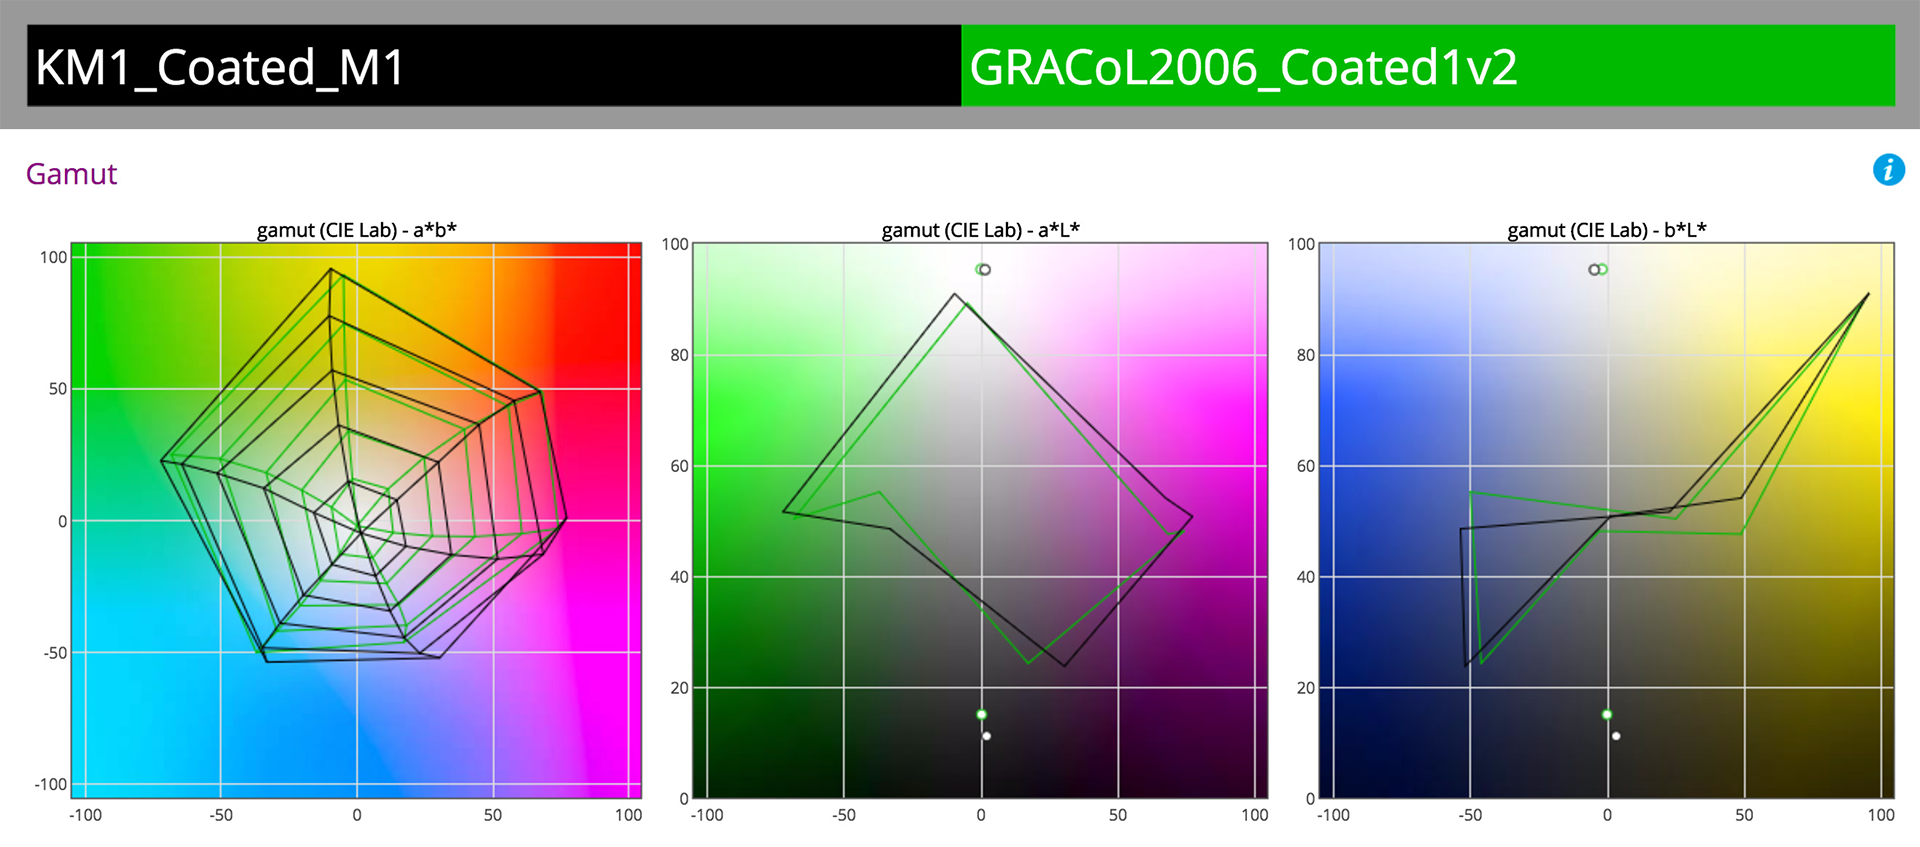
Gamut volume compared to GRACoL2006: 512,900

The following graphic represents the gamut of a digital press relative to GRACoL2006 gamut.
Pantone Coverage within 2 delta E (00)
ChromaChecker has the ability to calculate a PMS Library, being rendered on a given output device, to within a given delta E. In this case (KS- should there be another graphic here?), the Digital press can render 85% of the library to within 2 delta E (00) of the 2106 PMS Colors.
Benchmark #7- Accuracy of Digital Press to GRACoL
Using the TC1617 (IT8/7.4) Target to assess accuracy to GRACoL dataset
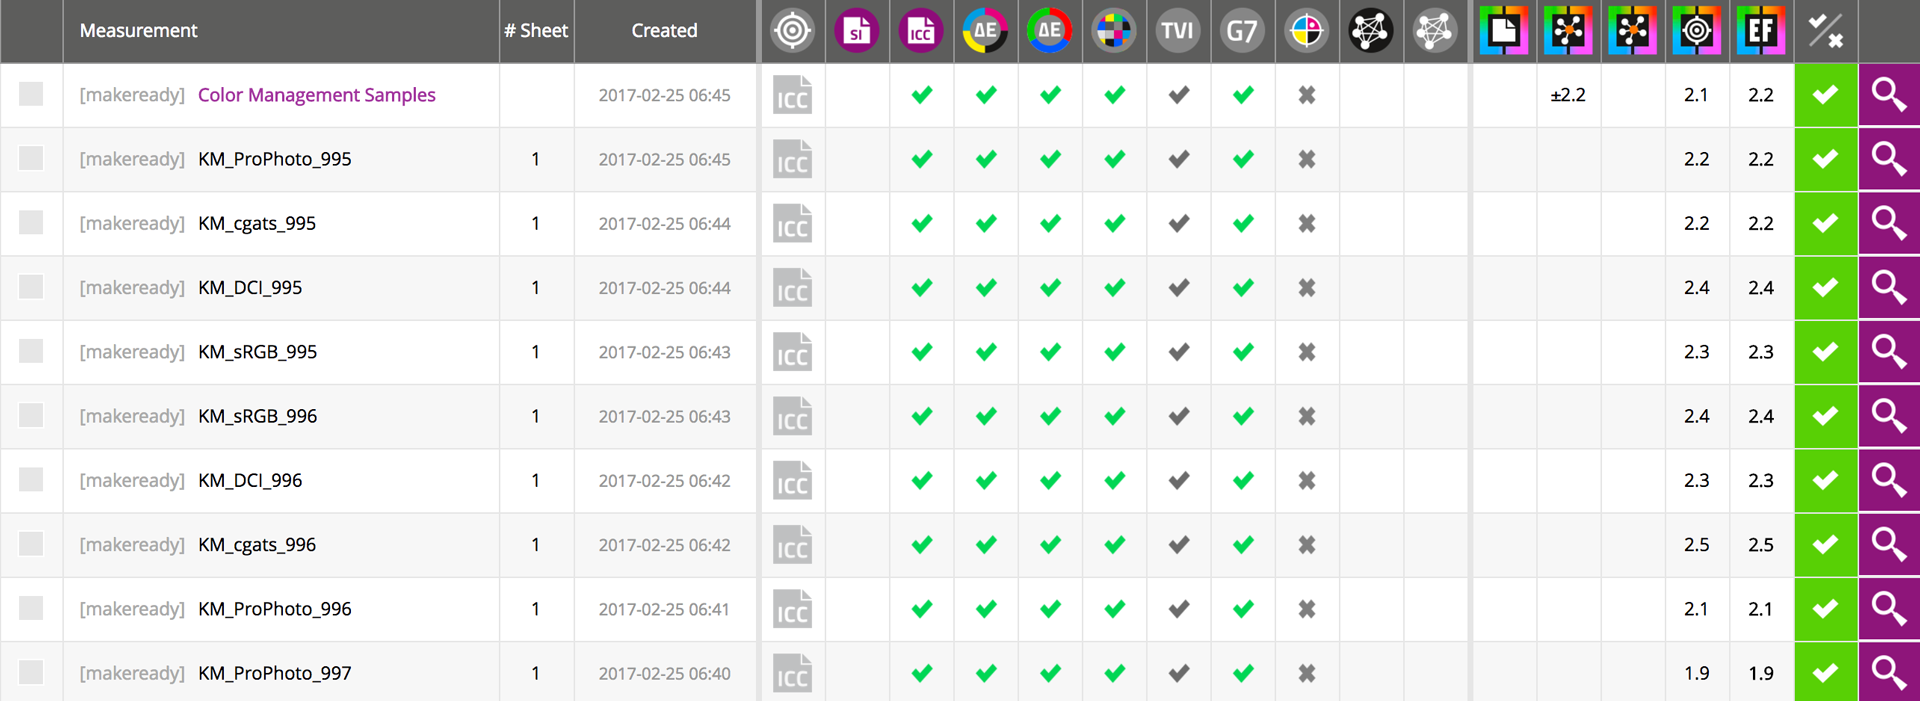
Based on the previous gamut exercise, neither printers should have a problem simulating GRACoL color space as long as they are properly process controlled and color managed. Here is the assessment based on the prints from the sample digital press:
|
|
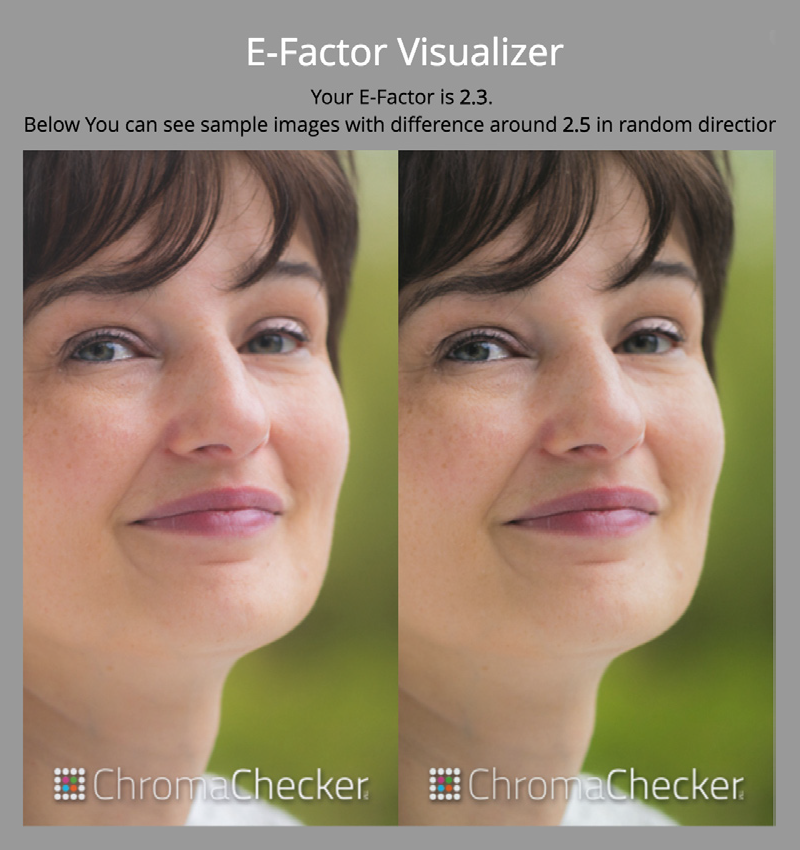
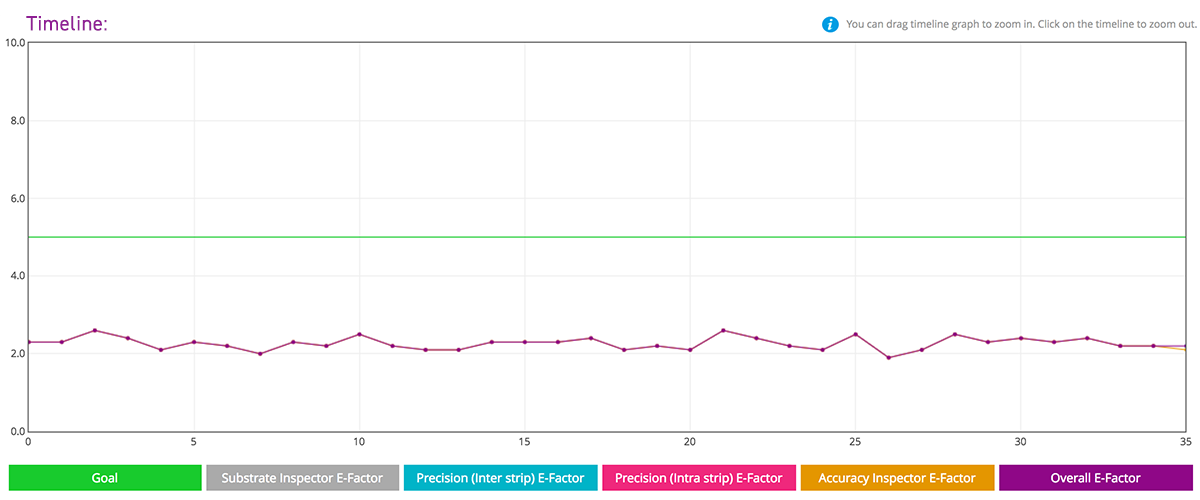
The accuracy of the digital press compared to GRACoL is represented in this line graph and table in terms of E-Factor of 2.3, which is represented by this Visualizer: |
 |
 |
Benchmark #8- Addressability of Digital Press
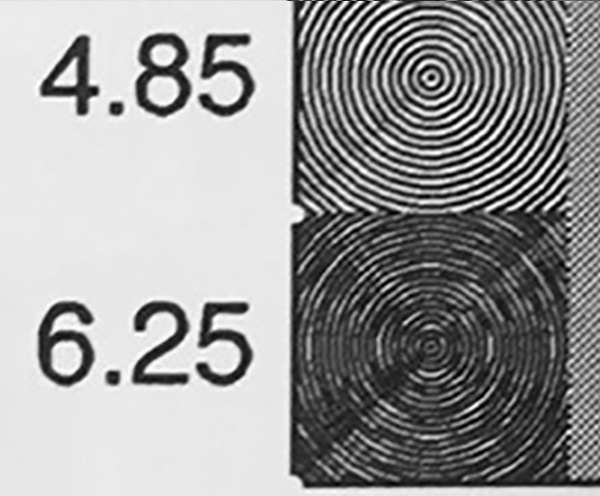
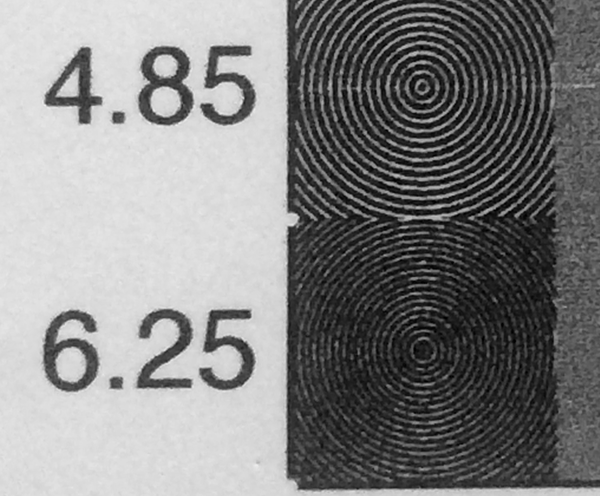
The ChromaChecker Test Target consists of an addressability component which helps to define the resolution and contrast which is capable in the print engine. There are multiple targets in use to determine how well a print engine can render addressability to differentiate different digital press vendors.
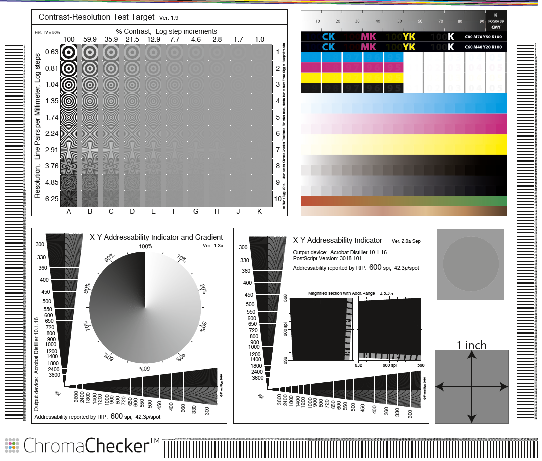
This target has a number of visual targets which allow a user to compare the resolution and contrast capabilities of the marking engine of the given output device. Below is a comparison of two digital presses printing the bottom left corner of the resolution/contrast target.
 |
 |
![]()