Optical Brightening Agents (OBAs) in Practice.
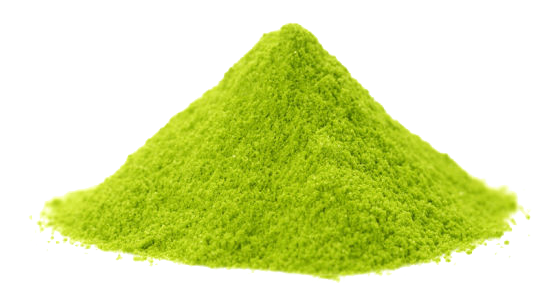
What are OBAs?
How to detect OBAs?
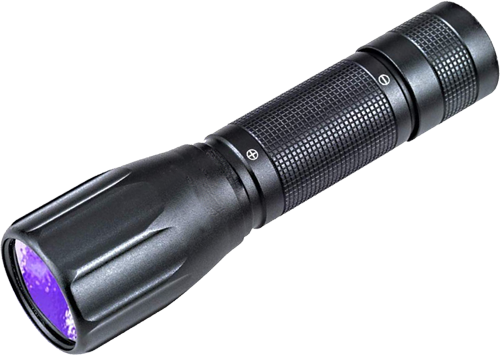
In a dark environment, use a UV flashlight to enlight the object. The UV will activate OBAs to produce visible blue light. But some UV flashlight uses narrow-band UV LEDs with non-optimal wavelengths, and the effect might be minimal or lost.
How to quantify OBAs?
ChromaChecker QuickChecker calculates two metrics that are very useful for quantifying OBAs. First is OBA Index, which calculates the difference in the measurement between M1 and M2 (which requires a measurement device to measure these two modes). Secondly, CC Capture drives multiple instruments capable of measuring in both M1 and M2 measurement conditions which are required to calculate the OBA Index. Additionally, in the Fluo tab, a spectral curve of M1-M2 is plotted with the dominant wavelength, and the peak value is reported.
These Instruments are capable of measuring OBAs Index or FI that can be used with CC Capture:
- X-Rite i1Pro 2
- X-Rite i1Pro 3
- X-Rite i1iO 2
- X-Rite i1iO 3
- X-Rite eXact
- Techkon SpectroDens
- NIX Spectro 2 (new model with M2)
- Konica Minolta Myiro-1
Steps to measure OBA's
- Launch CC Capture connected to your Instrument, log in with your credentials, go to QuickChecker.
- Place your sample on BW SI Backer (not mandatory for opaque objects)
- Trigger measurement
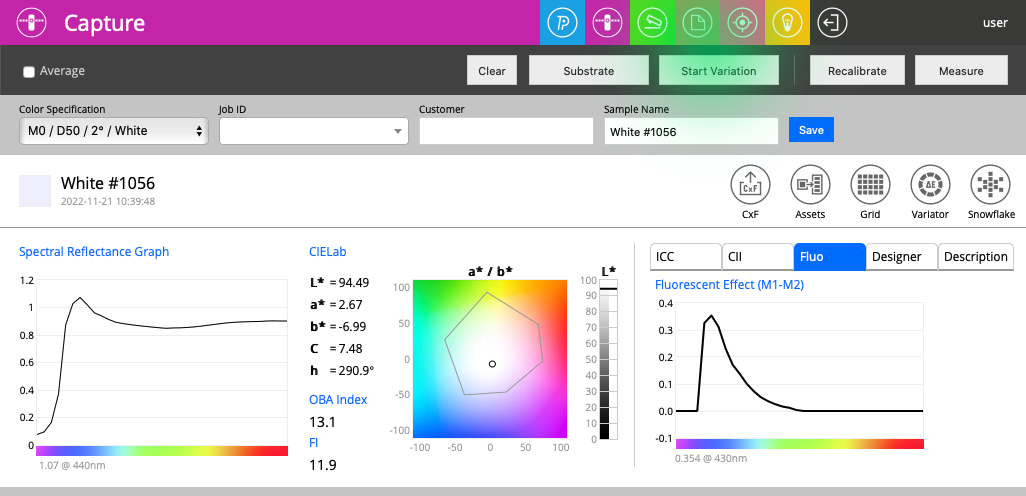
In the following example, OBA Index is 13.1, Fluorescent Index FI = 11.9, and the graph in the Fluo tab spectrally shows the s effect of fluorescence - UV light is converted to visible blue light with a dominant wavelength of 430 nm with the value of 0.354 - that means boosted reflection by 35.4%! The consequence of this extra blue light is 1.04 (104%!) on Spectral Reflectance Graph - when measured in the M0 measurement condition.
Let's change to M1 (in QuickChecker for most instruments, there is no need to remeasure sample) - just change the color specification (top light gray bar). Notice that in M1 CIE Lab, coordinates are updated, and Spectral Reflectance Graph is different - now the reflectance for 430 nm is 1.15 (115%)!!!
And to get a complete picture, let's switch to the M2 measurement condition - where no UV light is used to expose the specimen when measured.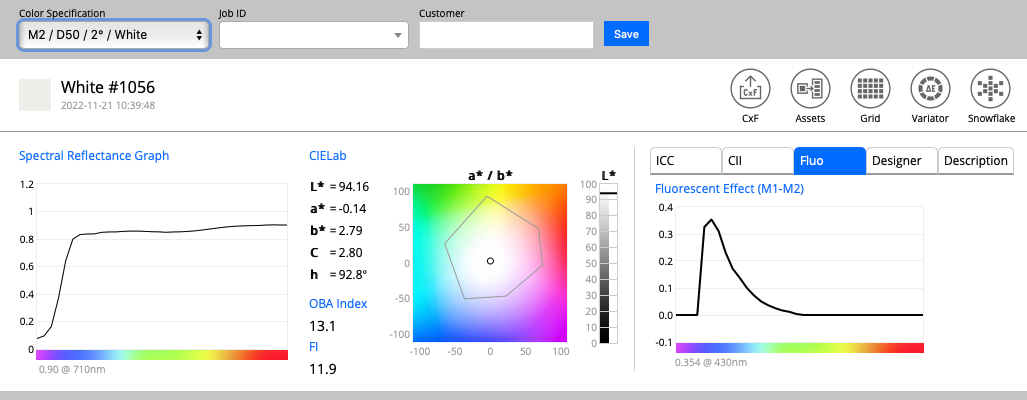
M0 Spectral Reflectance Graph doesn't have a peak at 430 nm - which exists only if the UV component is in the illuminating light.
This example shows the importance of choosing the right M sta-condition and the importance of UV control in the lighting conditions where the final product is to be displayed. ChromaChecker Lighting Inspector can measure any non-standard lighting conditions - and use this digital lighting fingerprint for calculations in many different areas.
Today, many of the lamps in our homes, department stores, and public places are LED-based, and most have NO UV radiation, but natural daylight varies from dawn to dusk. Whenever OBAs are applied, we can expect huge color changes.
Important Note
Please notice that the same sample measured with a different instruments reports vastly different Fluorescence Index (FI) or OBAs Index.
This is due to significant variations in the device illuminants and other variables. Many technical solutions have been focused on increasing the speed between measurements. Design and methodological simplifications mean that much of the measurement data is the result of processing by algorithms and does not always come directly from actual measurements.The part of the instrument that illuminates light to reflect off sample and pick up the reflected (color) result (especially in the UV range), deviate from the defined references they are supposed to follow. Manufacturers have introduced "data optimization" solutions that actually manipulate the data to enhance speed but do not follow the defined illuminant reference within the M1 specification. As different instrument manufacturers implemented different "short cuts” the end results are significantly different from one another as the table above proves.
Learn more: Instrument Comparison Experiment
Contact ChromaChecker Support
Additional information and Support Form is available for logged users.