Understanding variation
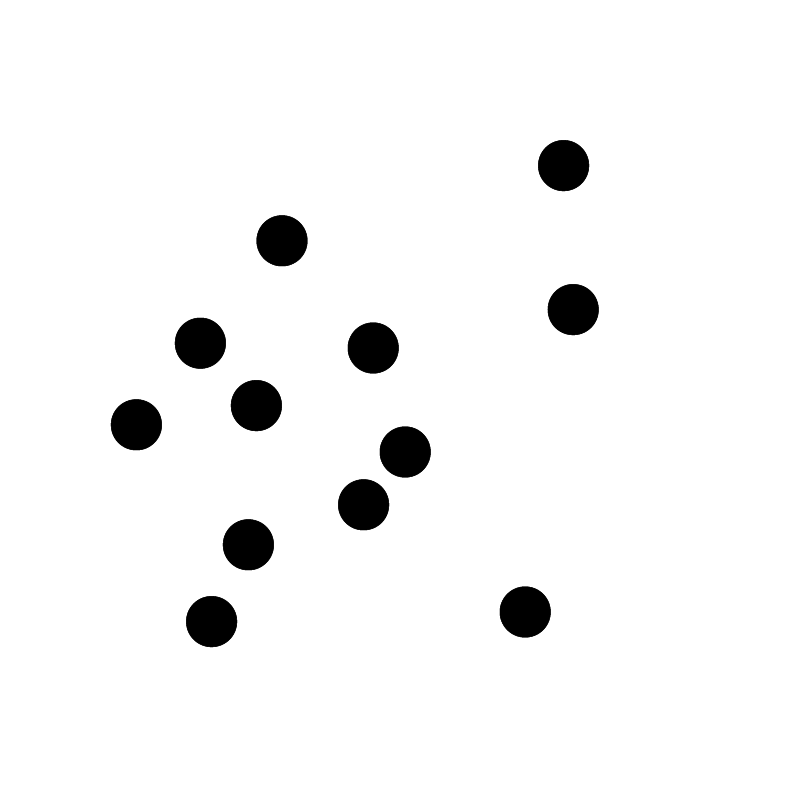
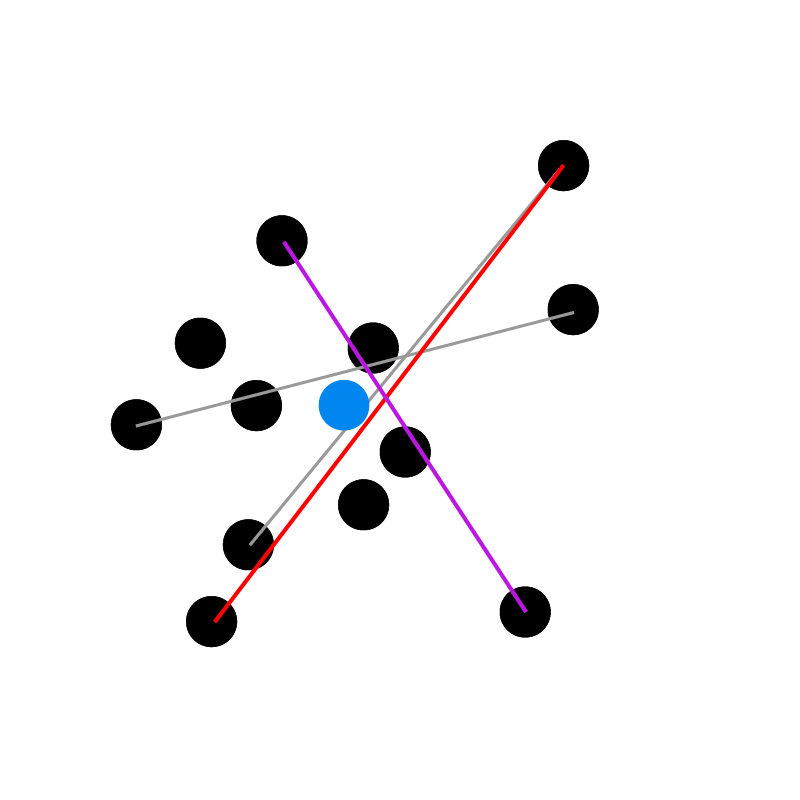
Let's evaluate 12 measurements captured using the "Variation tool" (QuickCkecker). Now - for demonstration purposes, let's make a two-dimensional layout of the sample distributions.
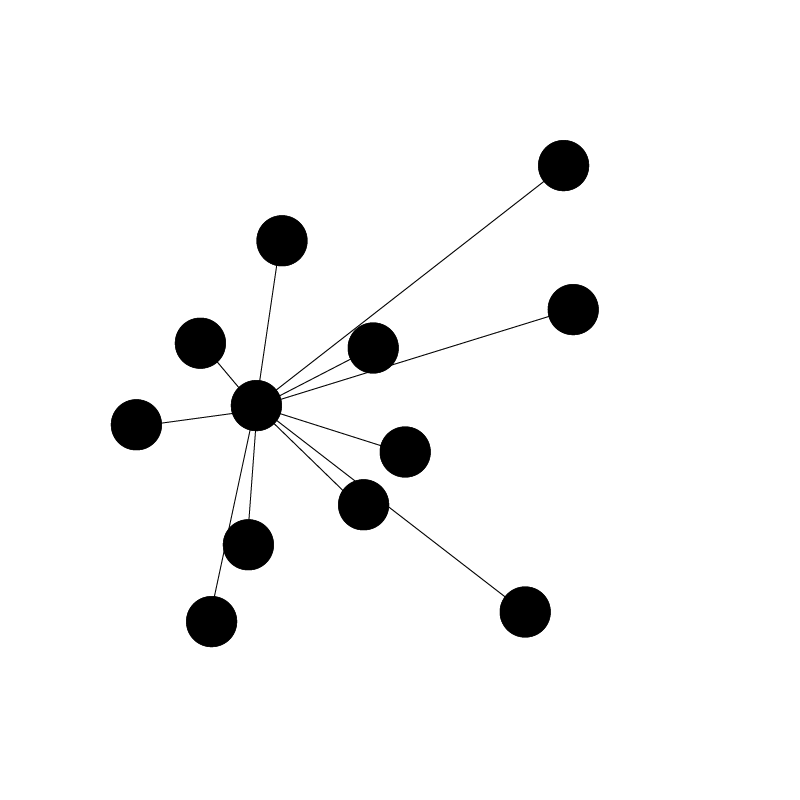
The variation tool compares all unique pairs of the samples.
For each measurement, the compared pairs look like this: (it is automatically compared to every other measurement in the variation.
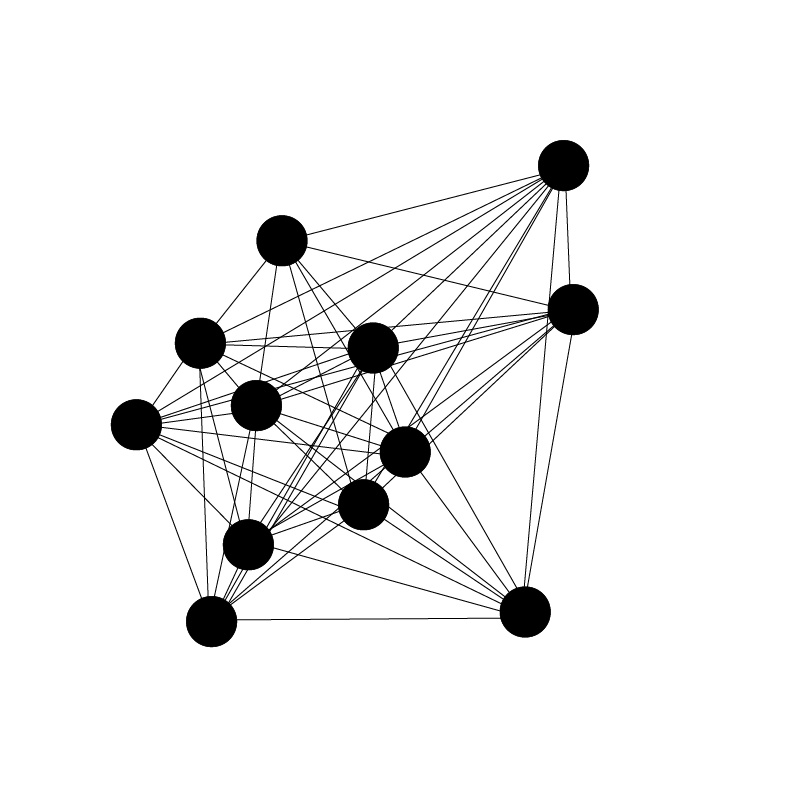
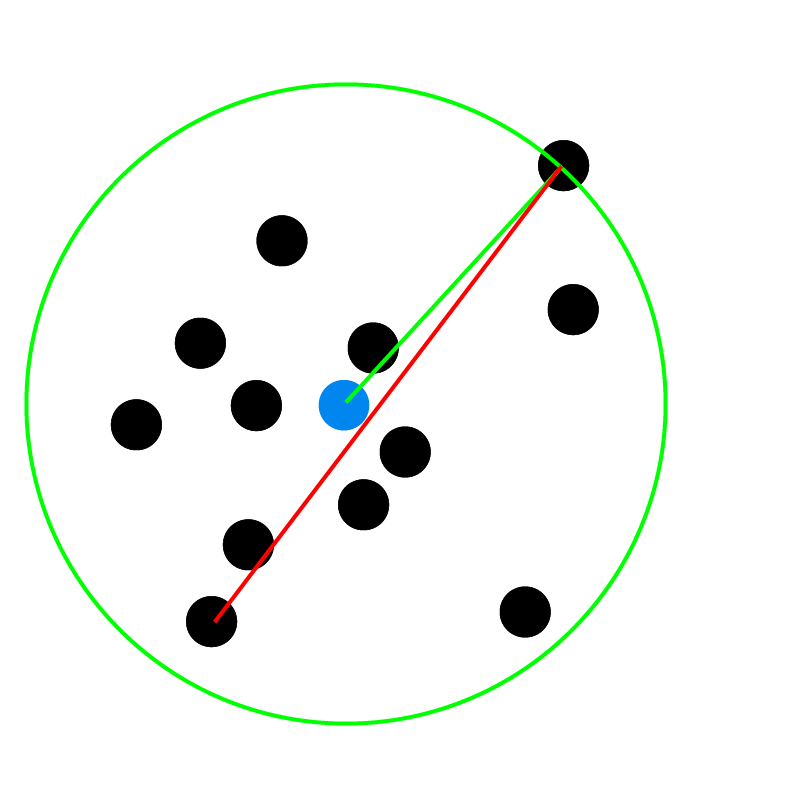
And finally, for 12 samples, we have 66 unique pairs of comparisons.
Now we can analyze all delta E's distribution organizing them from lowest to highest delta E
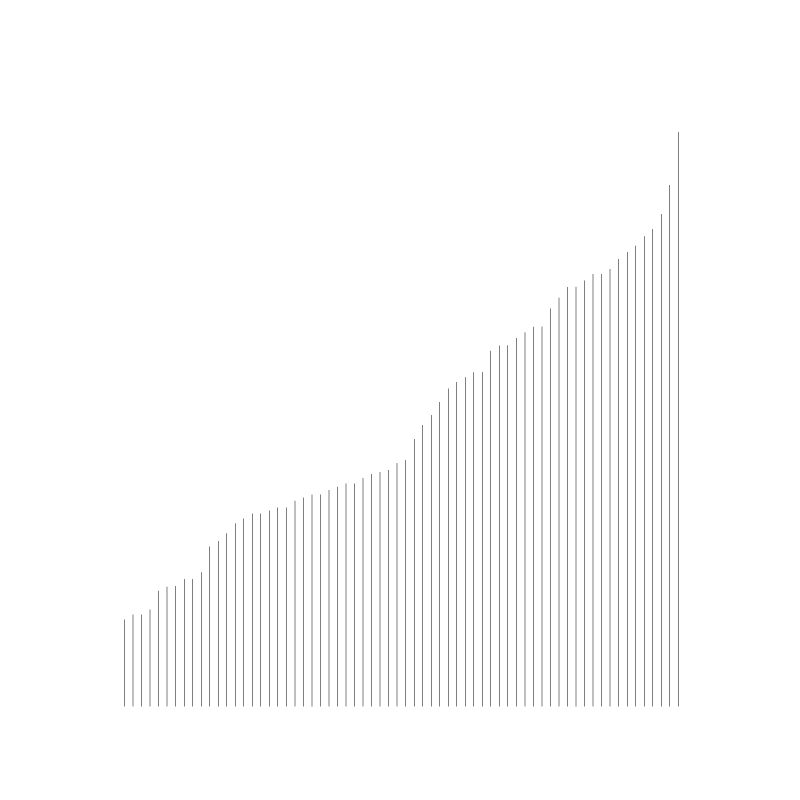
and in the next step, calculate key statistics
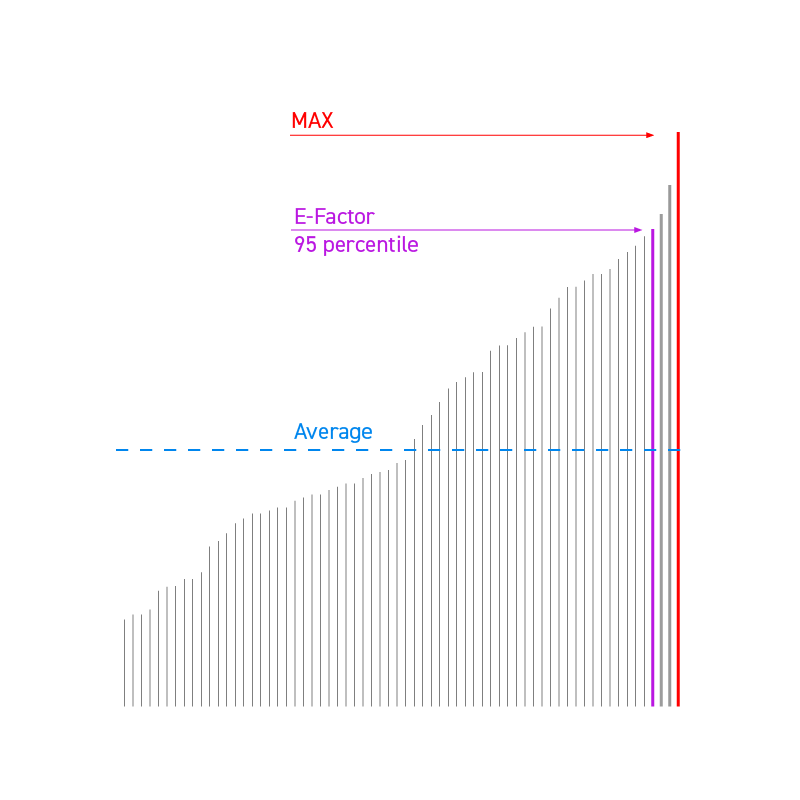 |
1. Maximum value 2. E-Factor 95th percentile 3. Average
|
That might be also presented in our layout as:
For the 95th percentile, we must eliminate the three highest values (red and two gray lines), based on number of samples.
Note:
Max value and E-Factor are related to existing measurements, while the average results from a calculation and doesn't represent a single absolute measurement.
Logical trap!
Most users may think that the variants are larger than they really are, because, for example, the maximum value expresses the distance between two extreme measurements - not the distance from the center, which may be the average value. in the case of a very even distribution, this value can be doubled - it's like comparing the radius of a circle with its diameter.
If the variation E-Factor is, for example, equal to 4.8 (where the value shows full distance), we can alternatively express it as ±2.4. The two have the same meaning, but now numbers are much more in line with how we are used to judging color difference when we have absolute value in the center.
4.8 ↔ ± 2.4
It describes the same case - but we have to be careful if the "± " (plus/minus) sign is displayed.
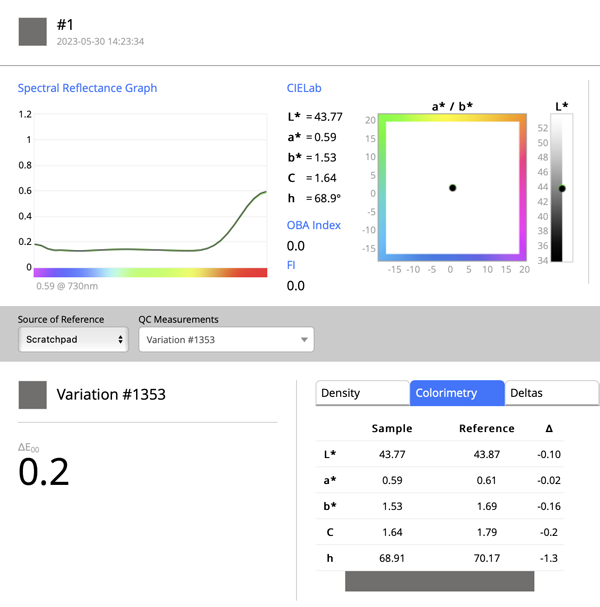
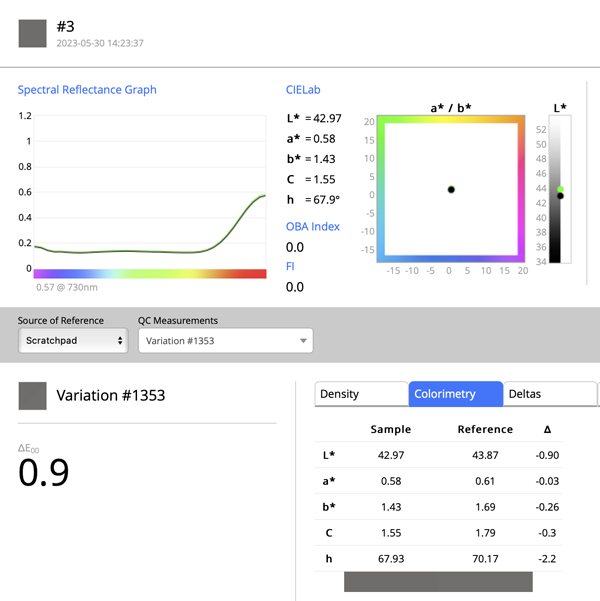
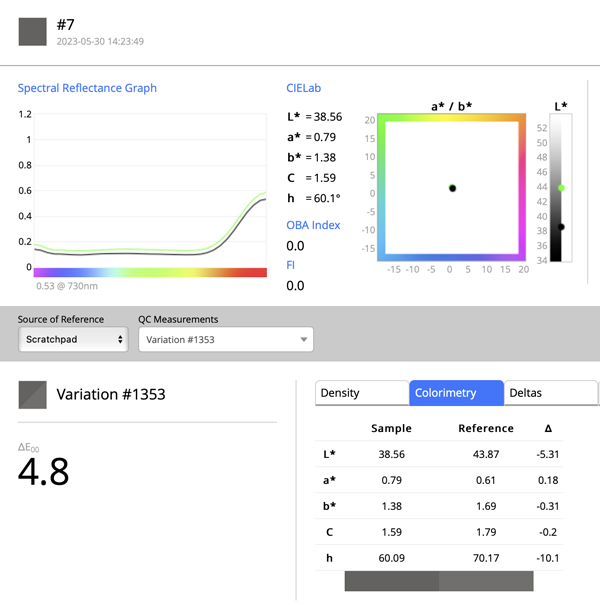
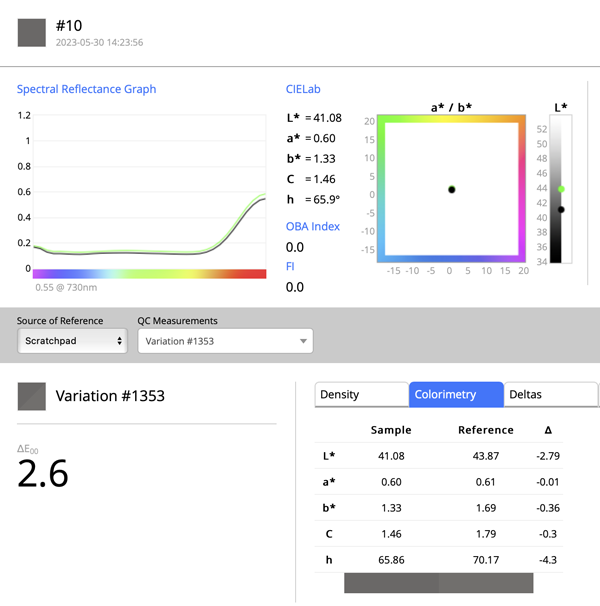
Practical example
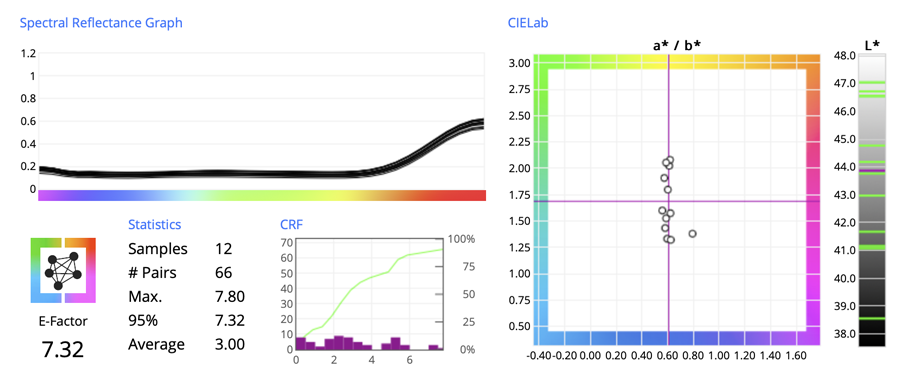
In this case, we have a Max value of 7.80 (± 3.9), Average 3.0 (± 1.5), and E-Factor 7.32 (±3.66)
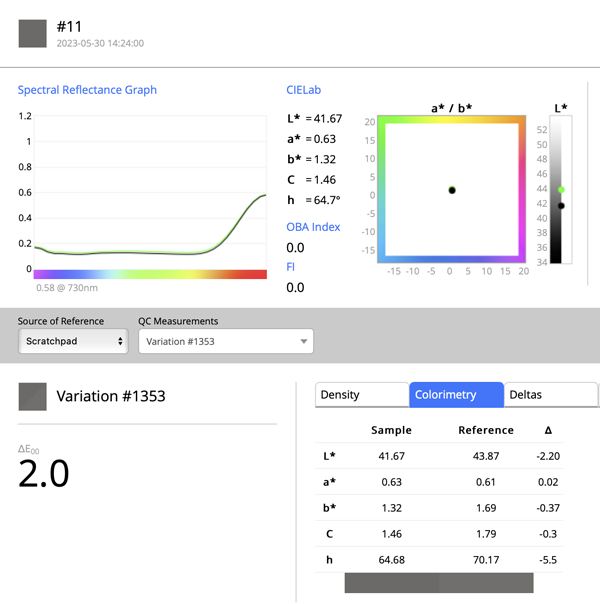
These parameters are Variations only - but the scratchpad makes it possible to use the averaged value as a reference for every one of the 12 measurements. This is a different evaluation and will compare different values, but we can see the value of variation analysis as we have fewer parameters.
 |
 |
 |
 |
 |
 |
 |
 |
 |
 |
 |
 |
This example shows how using fewer variables; we can substitute more complex and harder-to-maintain data. We recommend making a series of measurements whenever initially comparing samples, instruments, or methods. This will help prove the integrity of the measurement process which can be subject to inappropriate instruments for the substrate, or other variables not obvious to the user. If the initial variation measurements produce a high delta E E-Factor, more investigation has to take place to understand the cause for the high delta E values, and the current measured values can not be trusted to be used as a reference or sample. For spot measurement with handheld instruments CC Capture/ QuickChecker/Start Variation is an extremely fast and easy solution. Also, CC Print Inspector calculates variations on the fly. The same metrics are available in the Variations tab of the Print Inspector expert mode report.
Contact ChromaChecker Support
Additional information and Support Form is available for logged users.