Benchmarking Large Format Printer
Prerequisites for benchmarking/auditing
The purpose of the procedure is to evaluate and baseline the printer's "normal" condition. Every printer has different capabilities related to consistency, accuracy, and contrast resolution, and this procedure allows these metrics to be quantified and compared in a non-biased way to ensure it will meet the customer's expectations. All consumables (substrates, inks) and printing settings (resolution, speed, screening, and others) will impact results. This test will help to understand the interaction of these variables, for instance, the fast the speed, the less resolution, and the gamut. Faster is not better if the customer rejects the printed result.
Understanding how these variables influence one another helps a company make a more informed decision in regard to what the printer will deliver in terms of color consistency and accuracy. I have seen many situations where a print company bought a printer because it was fast, only to realize that the printer was not capable of matching a GRACoL Coated print condition within the customer's expectations... so the entire reason they bought the printer was not possible due to the lack of gamut.
There are three steps when Benchmarking a printer:
- Assessing Printers Precision (consistency)- check the precision on the same page, between pages, and between jobs.
- Assessing Printers Accuracy (Gamut Size)- In order to simulate another print process, the color of the printer doing the simulation has to be larger in all parts of the spectrum to simulate the other printer or reference, such as GRACoL.
- Assessing Printers Contrast Resolution- effectively assessing the crispness of the marking engine.
Notes:
- Unstable environmental parameters (Temperature and Humidity) may also have an impact on the quality of production.
- If the printed page is subject to any post-production finishing - additional steps in benchmarking have to be added to the final evaluation.
Your target to benchmark the printer depends on your measuring device and aperture. This affects the target's patch size and layout.
| Instrument type | handheld w/scan option | spot only | XY Instrument |
| Supported models |
X-Rite eXact, |
Nix Spectro 2
|
X-Rite iSis |
| Notes | An instrument with a scan option and regular patch size. It already has some repeated patches; the total number of instances can be reduced to a smaller layout (3x3) |
Big patches, big aperture, textiles |
|
| Control Strip | CC-84 | Minimal G7 | CC-84 |
1. Printer Precision - Variation
Create a grid using the max-width of your printer. Repeat the selected control strip (in this example Minimal G7) a couple of times in a row and repeat this row a few times. In most cases, the layout is optimal (5 columns by three rows). That will collect data from 15 different locations on a single sheet.
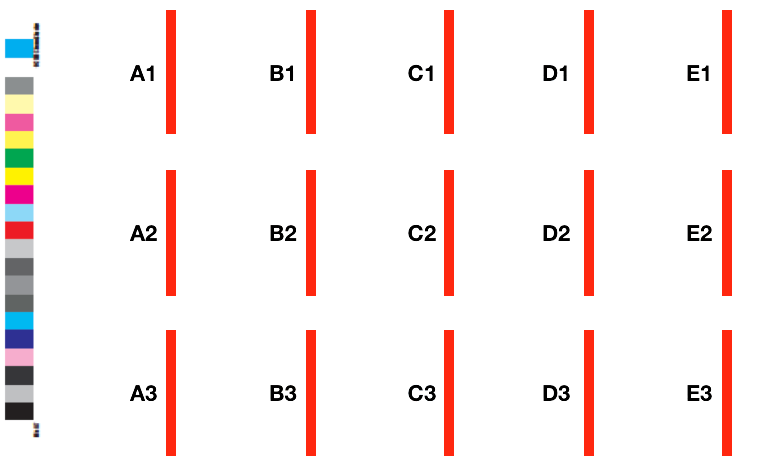
In this example - we have a 3 x 5 layout = 15 single measurements - when we compare them together - we have more than 100 unique combinations - that is a great source of statistical analysis!
The following table compares typical layouts:
| layout | total measurement | unique pairs | |
| 3 x 3 | 9 | 36 | |
| 3 x 4 | 12 | 66 | |
| 3 x 5 | 15 | 105 | |
| 4 x 4 | 16 | 120 | |
| 4 x 5 | 20 | 190 | |
| 5 x 5 | 25 | 300 |
Unique pairs - what it means?
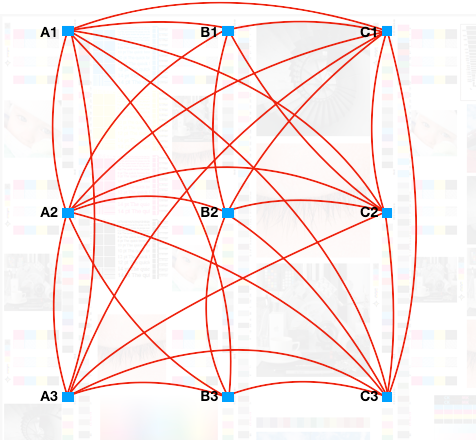
Variation analysis compares every single pair - that means we compare each color patch of the same kind with all others. If the number of pairs is about 100, then the 95 percentile statistic formula becomes more accurate - and this is how E-Factor is evaluated. That is why a 3 x 5 or bigger layout is recommended.
How to measure and evaluate?
- Measure all control strips using CC Capture - Print Inspector. You may use a smart naming convention (consult paragraph below) and enter names in the Job ID field. With a barcode reader, it is very simple.
- Go to Print Inspector on Expert Account (Cloud), select all measurements and create a group. Click on the magnifying glass to see the report for the group. Choose the tab labeled "Group Variation" this will report the amount of within-sheet variation the print is exhibiting. If the E-Factor is greater than 3, the report will show which color(s) are exhibiting this high variation which will help you fix this issue.
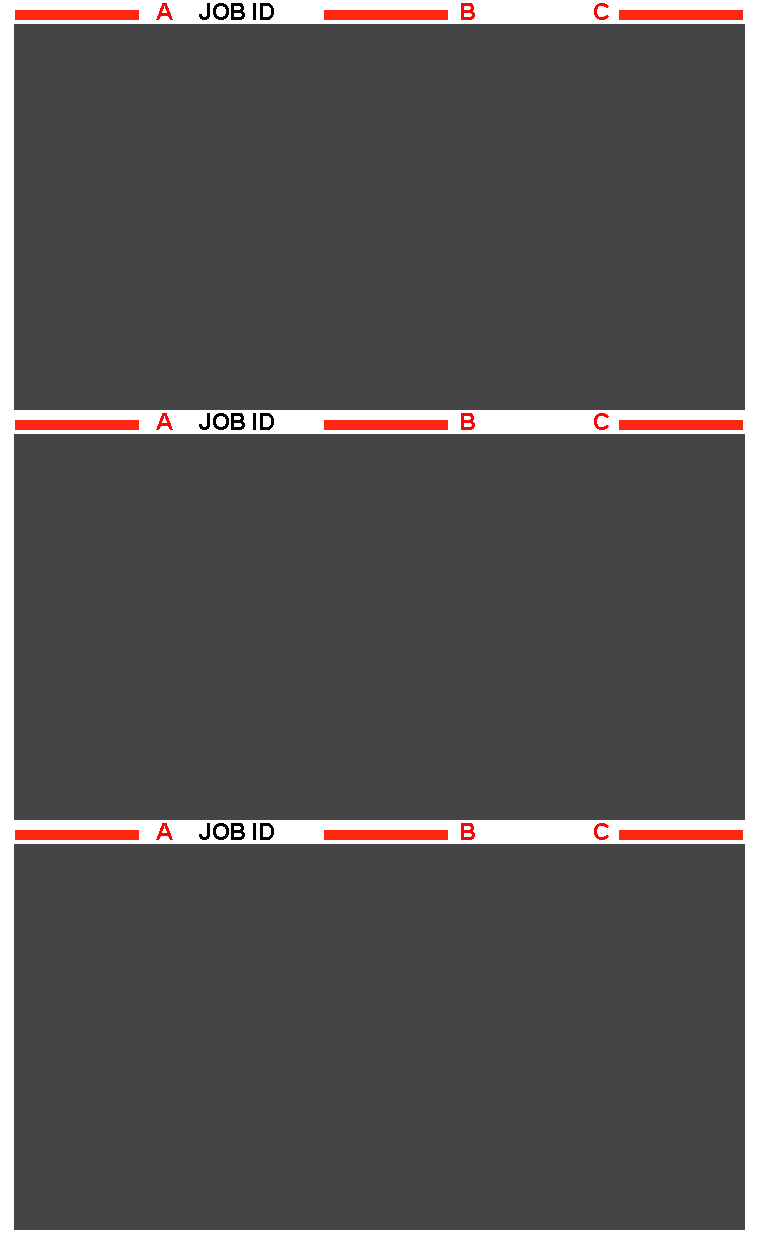
Smart naming, sub-groups, and benefits from deeper analysis.
It is not mandatory but using smart names makes it easier to create additional sub-groups. Using barcodes, it is possible to assign to each location name like A1, A2, A3, B1... ( see diagram above). With such names (Job ID) it is easy to group all 1s, 2s, ... As, Bs, - which means we can evaluate single columns or rows. Thus, we can easily have many groups from one series of measurements. Each of them will allow us to see if the potential problem of low repeatability is, for example, only the top or bottom of the sheet or is related to the left or right side.
The following table contains ready-to-use barcodes that are CC Capture compatible (click to download)
| A | B | C | D | E | |
| 1 | |
||||
| 2 | |
|
|||
| 3 | |||||
| 4 | |
||||
| 5 | |
Click on the image to download it.
How to create a test form
- In your graphic design software (e.g., InDesign), create a page size that reflects your typical production.
- Select a layout that you prefer, like 3x5
- Decide which is the largest reasonable patch size for your Instrument - bigger is better - but the ruler of the Instrument might limit maximal size. Take into account - the Minimal G7 has 21 patches.
- Create a scanning template for your Instrument - that will make a PDF file ready for download.
- If you have a barcode reader, create QR codes (or any other type) for every location using a smart naming convention.
- Create output PDF with no ICC Profile assigned (PDF/X-1a:2001)
(Color Conversion - No Color Conversion, Profile Inclusion Policy: Don't Include Profiles)
60"x 48" LFP Test Form
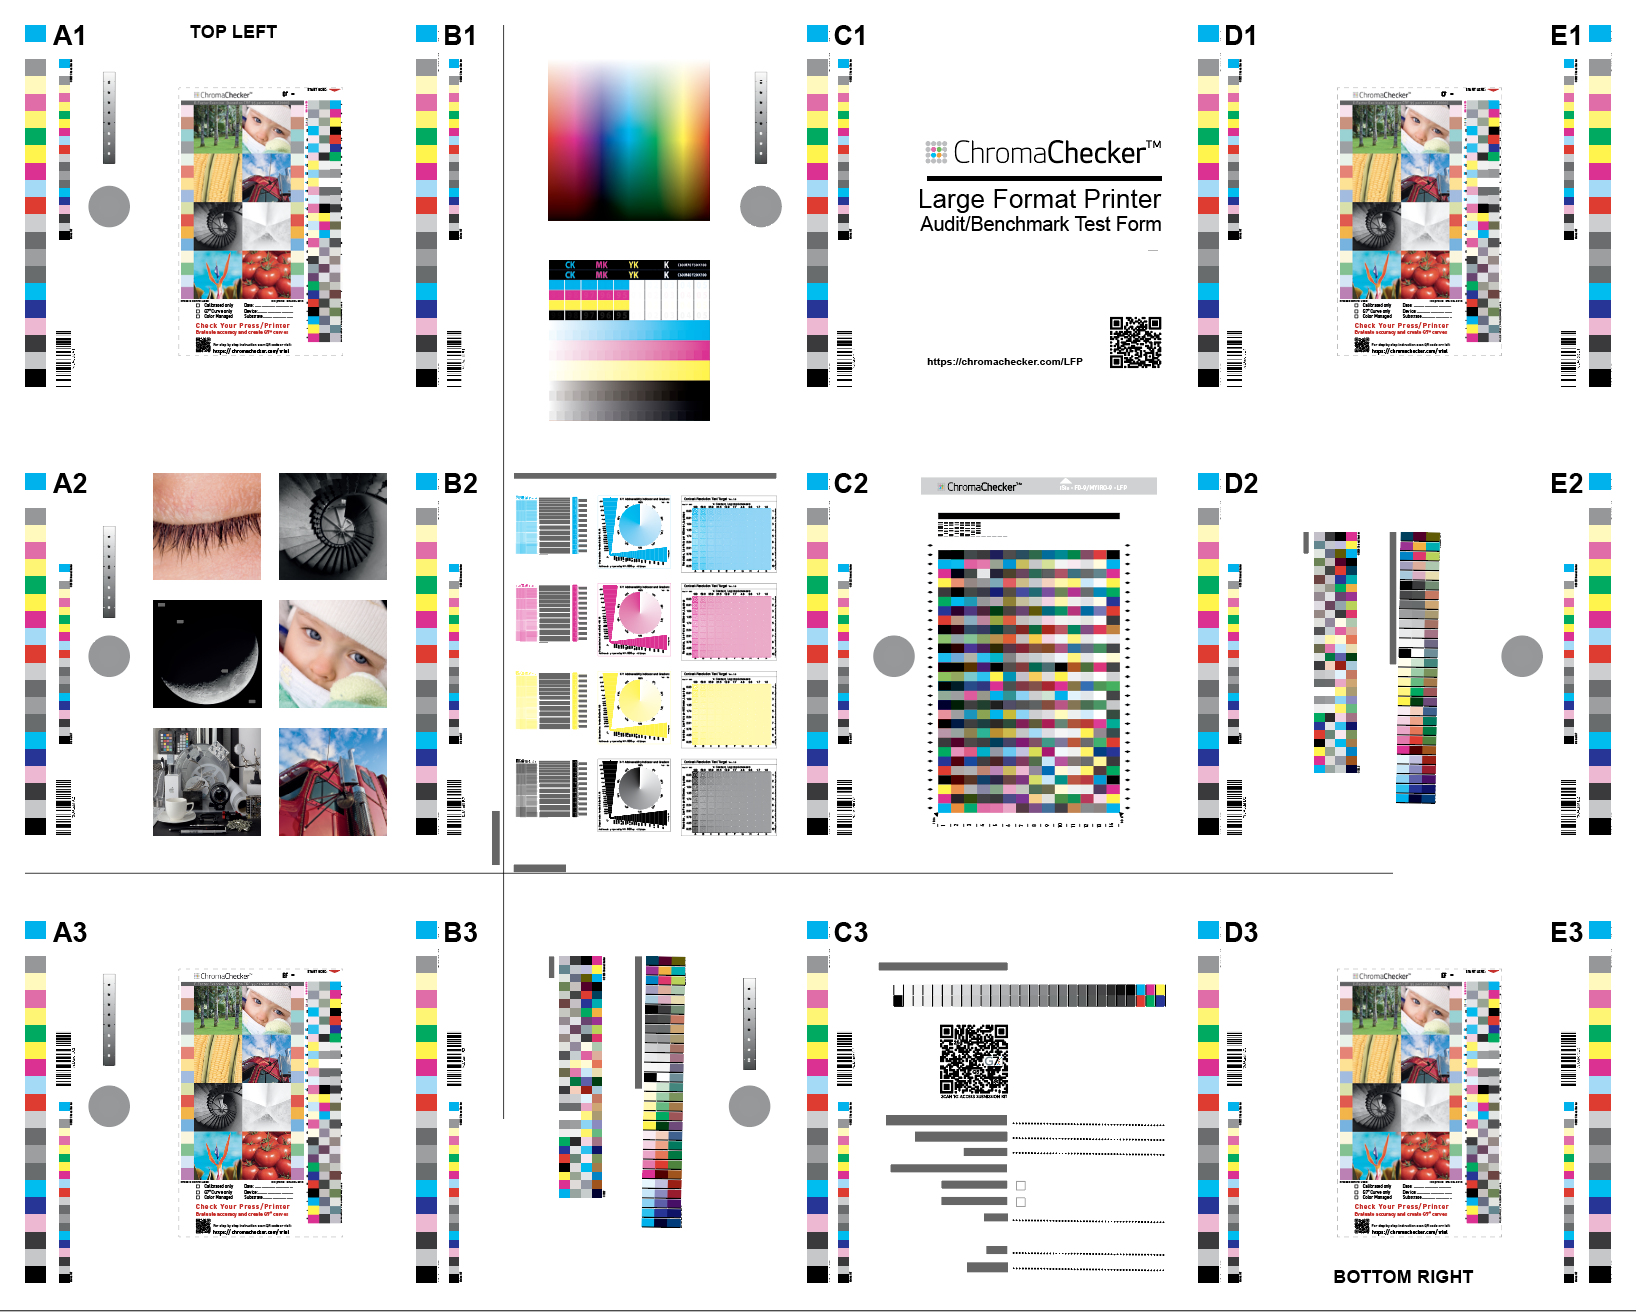
We have created a test form with two sets of control strips 8x10 and 16x16mm. The page size is 60" x 48" and it contains additional elements for visual evaluation that include addressing. You may adapt this page to your requirements but the addressability elements cannot be scaled. You may contact us and get access to the InDesign source file and all components.
Depending on your Instrument use a bigger (i1Pro3 Plus, NIX Spectro 2, Variable Spectro 1, ...) one (16x16mm), or a smaller 8x10 mm (i1 Pro-Family, Myiro-1, SpectroDense, eXact Scan, ...).
The test form is created with copyrighted components. Some addressability elements are granted to ChromaChecker by the author Franz Sigg.
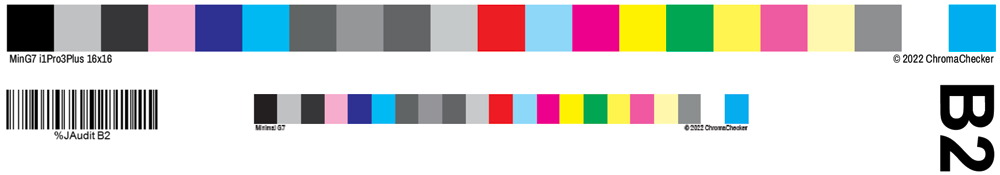
Every single Minimal G7 color bar has a unique barcode that CC Capture will use for Job ID. At the bottom of this page, there is a link to a PDF file - it is free to use for all registered ChromaChecker users (login to see).
To learn more about how to interpret supplemental visual elements please click here.
If you don't have Minimal G7 loaded in your ChromaChecker instance,
please import it by clicking below:
In the section related to your instrument look for one of the following:
| Minimal G7 8 x10 mm |
Minimal G7 LFP 16 x 16 mm |
Patch size notes |
|
| X-Rite i1 Pro 1,2,3 | |
patch width is critical, do NOT scale | |
| X-Rite i1 Pro3 Plus | patch width is critical, 16mm min, do NOT scale | ||
| X-Rite eXact Scan | patch width is critical but the user may enter patch width in CC Capture. | ||
| Konica Minolta Myiro-1 | not critical, moderate scaling allowed | ||
| Techkon Specto Dense | not critical, moderate scaling allowed | ||
| Variable Spectro 1, 1Pro | not critical, moderate scaling allowed | ||
| NiX Spectro 2 | not critical, moderate scaling allowed | ||
| DS700D | has not been implemented yet. |
Not found? - create a new one!
If the proper Scanning Template does not exist or has the wrong patch size — create a new one. Go to the tab called:
and click:
Combine a Minimal G7 control strip with your Instrument and the requested patch size. Once saved, it creates a PDF ready to download.
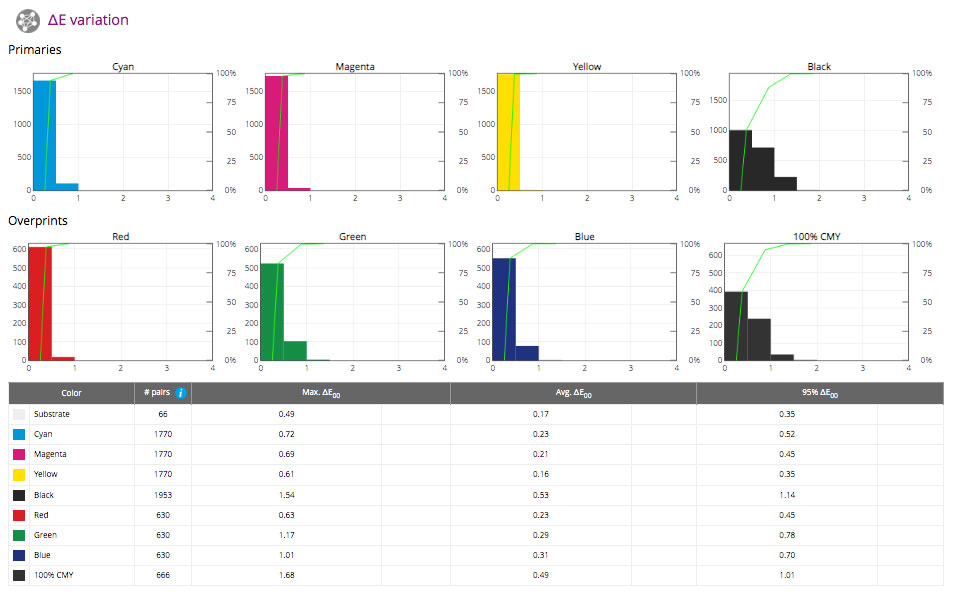
Example reporting
Variations — Primaries and overprints solids
Variations — Tints
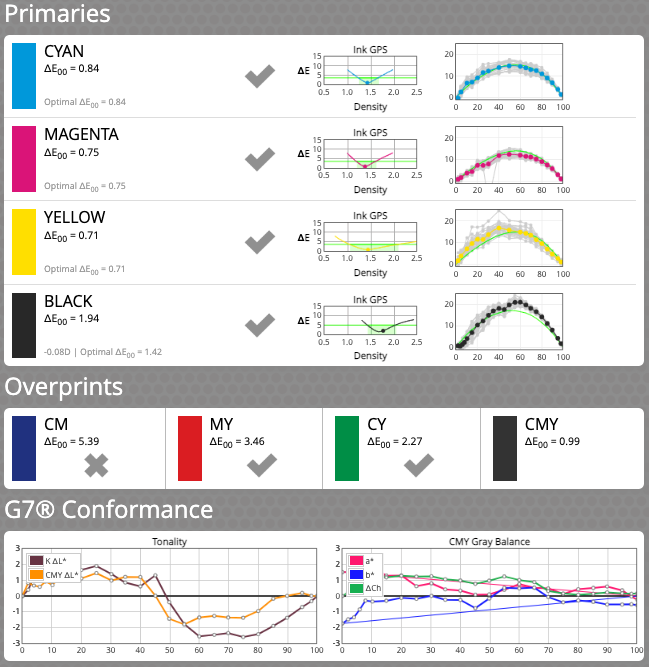
2. Printer Accuracy
The same set of measurements delivers all kinds of data - no extra work is required - open another section of the report.
There are a lot of subsections - take into account that accuracy analysis is made using averaged data! It is important to start from variations to learn more about repeatability before averaging.
Summary
The summary brings some visual vision of averaged data versus individual measurements.
On the right side, we can see a lot of gray dot gain curves and averages marked with color.
Accuracy to Target
This report is divided into several subsections:
- Substrate
- Primaries
- Overprints
- All Patches
- ISO Gray Balance
- Gamut
- Ink GPS
- Dot Gain
- CMYK Spread
- G7 Conformance
- Trapping
Compare to Baseline
Print Inspector allows parallel analysis not only to the pattern - defined by the ICC profile - but also to the baseline, which may reflect the "normal" operation of the printer. Such baselines can be very practical for detecting deviations from the normal state, which will not always perfectly correspond to the ICC profile - especially the standard one.
Continue tracking your LFP during regular production.
Place a couple of control strips in the Slugline or in Slug Area. With Benchmark results as a reference, it is easy to compare any production sheet to the printer baseline. It is not required to measure all control strips but randomly at least a few. If a difference is detected - that may be caused by an issue. In this case, that may prevent production from time and consumable wastes.
The slug line, which separates jobs typically used for job descriptions, may offer enough free space to place control strips without wasting extra substrate. The best method is to edit the slug line on the RIP. Three instances on the left, center, and right sides might be very useful for stability and repeatability evaluation.
3. Printer Contrast and Resolution
Print this file at the given speed and a number of passes to compare different printers with one another to realize what the tradeoffs are related to speed and quality.
Addressability Test
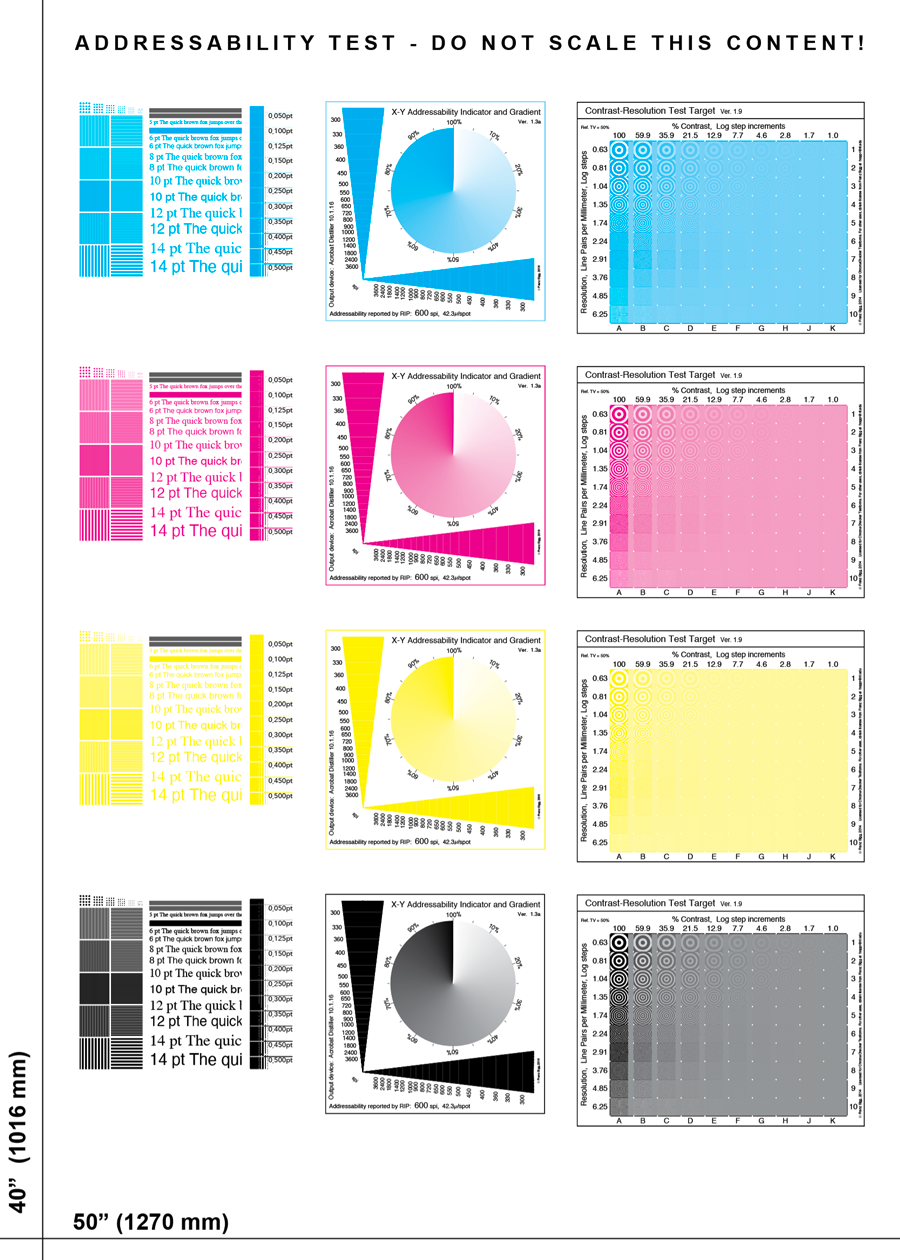
Additionally, two long lines help to check vertical and horizontal dimension accuracy.
To learn more about how to interpret supplemental visual elements please click here.
PDFs
Contact ChromaChecker Support
Additional information and Support Form is available for logged users.