Optimized for color space homogeneity
The ChromaSpot Library is analyzed for homogeneity. An Advanced script checks the relationships between the colors.
Our algorithm analyzes not only the distance to the closest color but also the next neighboring colors in all dimensions. This library was created based on more than 18,000 samples, most of which were removed by the algorithm as redundant. The library meets all the requirements set for it, but due to the existence of highly saturated colors, it remains open on its edges to accommodate samples that go beyond existing values. Based on how actual color samples may have saturated values, they can be added and extend the ChromaSpot library.
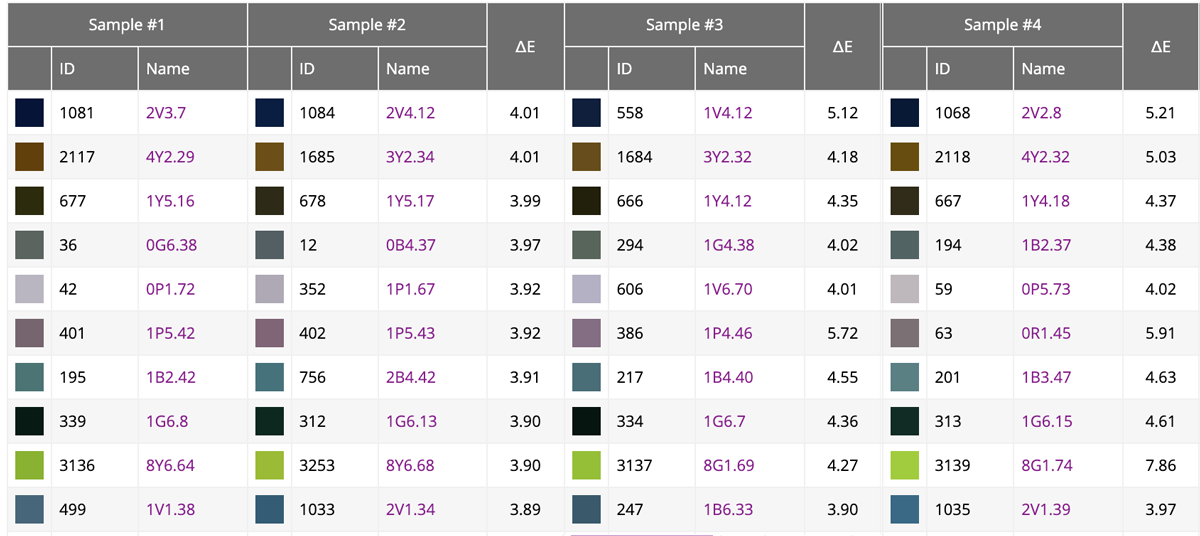
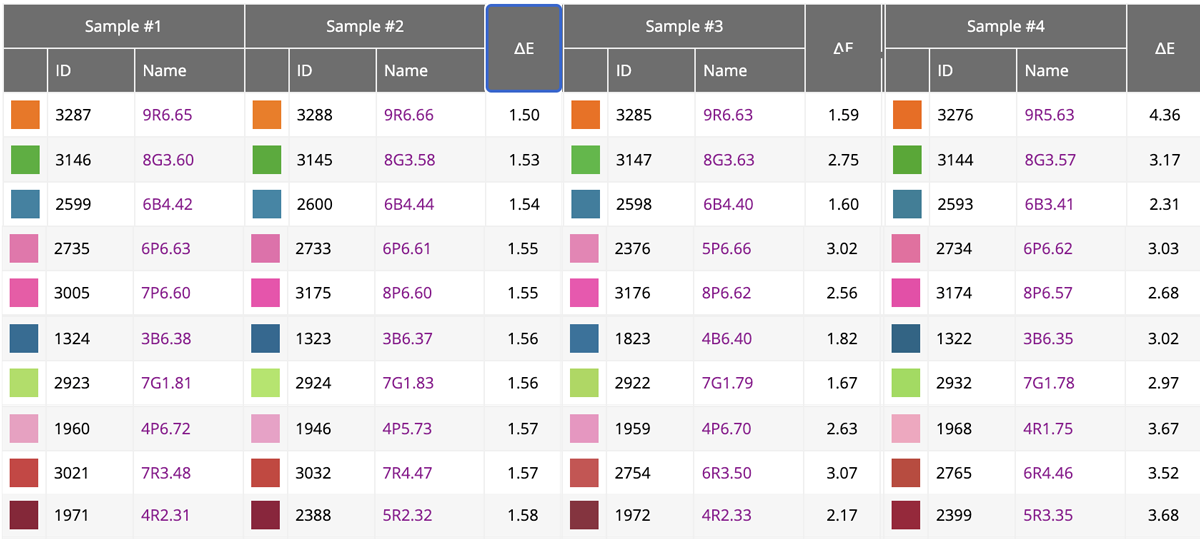
The principle is to keep small, visible differences for samples. There is no practical reason to keep two samples less than 1∆E 2000 as the perceivable difference is too small to make a difference. In addition, the difference should not be higher than 4∆E as such differences prove that some colors are not represented by Library even if we accept a tolerance of 4.
The following report shows 10 sample pairs where Sample #1 is compared to the first closest neighbor (Sample #2) has the highest value. Additionally, the calculation is performed for the second (Sample #3) and third (Sample #4) neighbors.

On the other end of the list, samples with the smallest delta E's are analyzed.

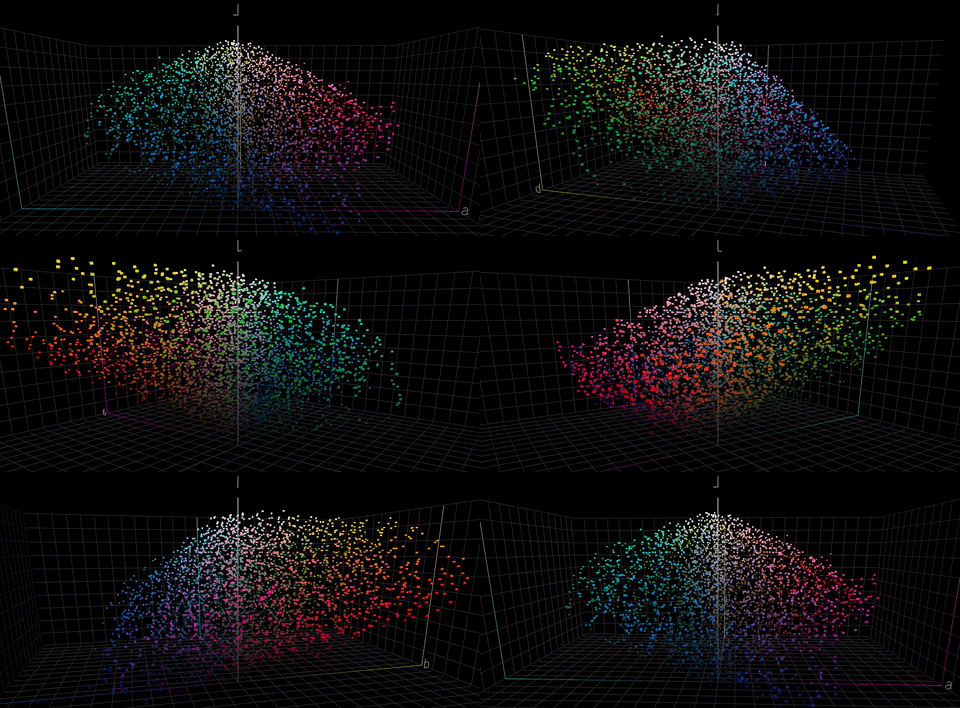
At this moment Library contains 3360 samples. Visually the homogeneity is not perfect - but the Lab color space is not perfect. In addition, all samples in the Library were created by an i1 Pro3, and it is not easy to find samples that fill some gaps, which can be observed in 3-D space animation. No new samples have been added in months during our beta testing, but if anybody can find a color that fills a gap, please send a physical specimen to us. We will measure with the same instrument and add it to the library. If you want to check yourself, you can use an i1pro3 with CC Capture, and if your sample is more than 4.0 ∆E from existing ChromaSpot samples - export the measurement to CxF format and email it to us for possible inclusion.

This type of analysis does not protect against the existence of isolated, empty areas visible in the animation below. However, it must be remembered that the library was created from physical measurements based on the collected printouts. It should also be remembered that visual assessment is not fully reliable as the Lab color space and the ∆E2000 formula is not linear. The colors represented by points outlying the main values are fluorescent samples, which are limited.
Contact ChromaChecker Support
Additional information and Support Form is available for logged users.