Print Inspector Expert mode
How to interpret data
Most examinations are made based on two different ∆E formulas as industry requires.
1. Substrate
This function shows how close production stock is from target value specified in the workflow.
Comparison to ICC profile before SCCA (requires SCCA on). By turning SCCA calculation on, the system will recalculate Reference Printing Aims to a current substrate. It is strongly recommended to use M1 measurement condition and remember that this formula works correctly if ∆E <5.
Comparison to substrate library (requires substrate connected to the track) Connecting substrate from Substrate Inspector library helps to track consistency.
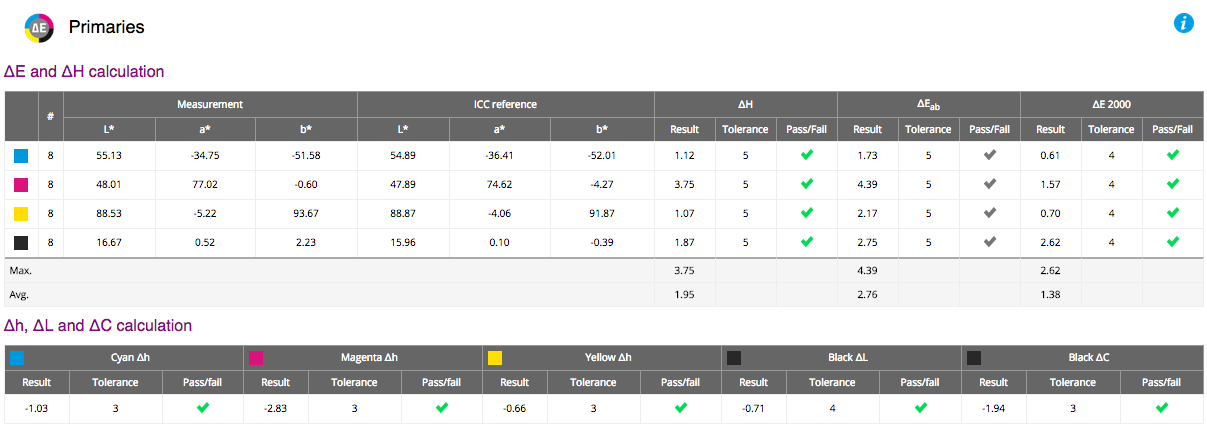
2. Primaries
The key examination for both TVI or G7® methods.
We expect that primaries will be printed with specified tolerance.
That means amount of ink or toner used for solid areas of process colors. Further analysis will give come more information
how to set device for the best match, on this stage values are compared to target only.
Additionally some extra calculation (∆H, ∆L, and ∆C) is made to fulfill demands described by standards.
If primaries are out of tolerances, you have to change an amount of ink/toner. You can try to find if actual print
conditions are closer to another Target Printing Aims - for this task use "Match ICC" tool (located on Top Navigation Bar).
All your ICC profiles (consult your Assets) will be compared to results.
3. Overprints
The comparison for Secondaries is similar to Primaries.
Typically values are higher than for primaries. If the difference is big check if the color sequence is proper. 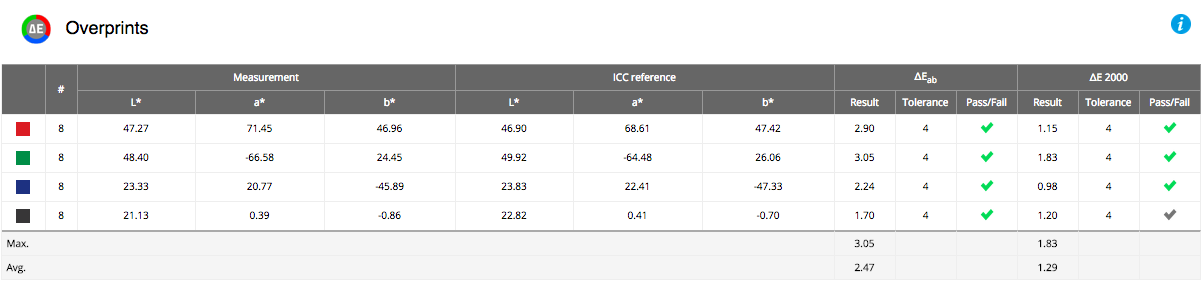
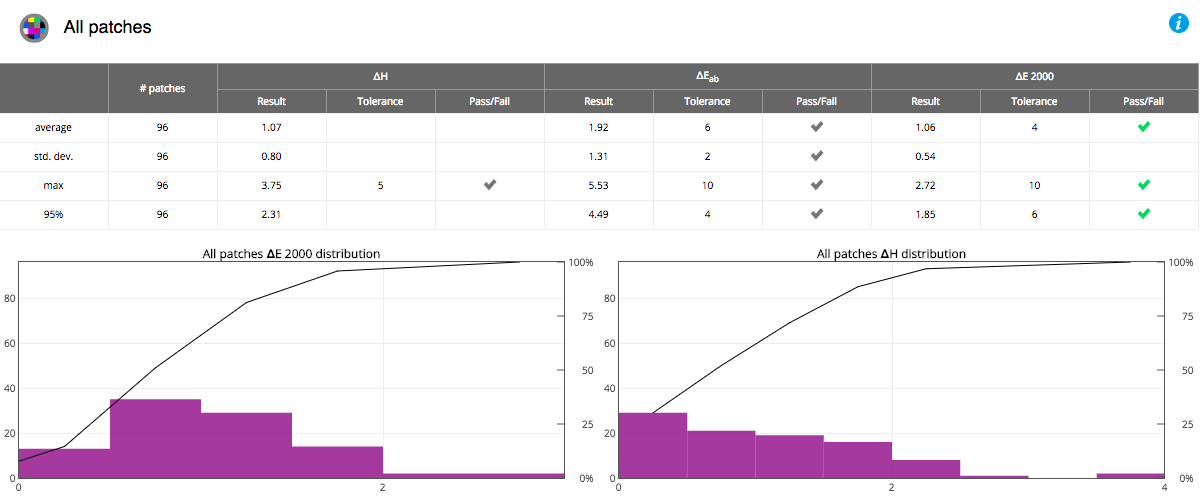
4. All patches
This is a simple test for all unique patches. If in the file there are repetitive patches - an average value will be used.Peak (maximum), mean (average), 95 percentile and standard deviation are calculated, and two graphs shows statistical
error distribution (histogram and Cumulative Relative Frequency – CRF) for both ∆E & ∆H.
The horizontal axis is separated for 0.5 ∆E bins, used to categorize differences.
The vertical axis shows the number/percentage of patches that fail in each bin.
CRF is the sum of all the bins values.
E-Factor™ is defined as 95 percentile of all patches ∆E 2000.
Example 1 – high-quality offset/coated (E-Factor = 1,9)
5. Outer Gamut patches
Test similar to "All patches" but applied to so-called Outer Gamut patches only (list specified in ISO12462-2)
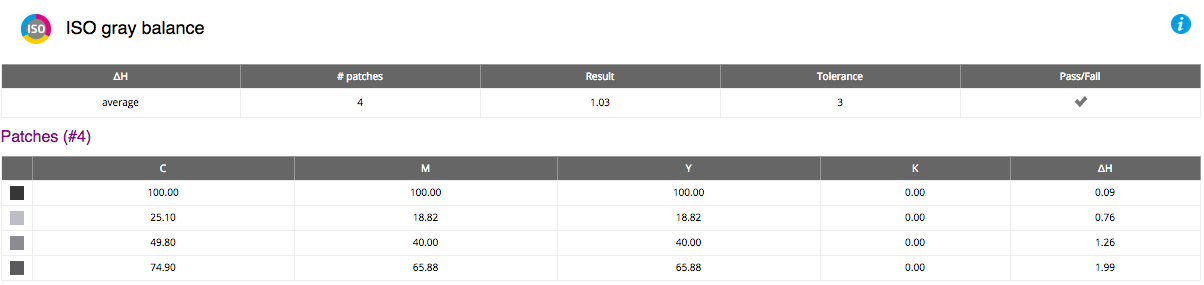
6. ISO gray balance
Patches recognized as grays are examined for ∆H differences.
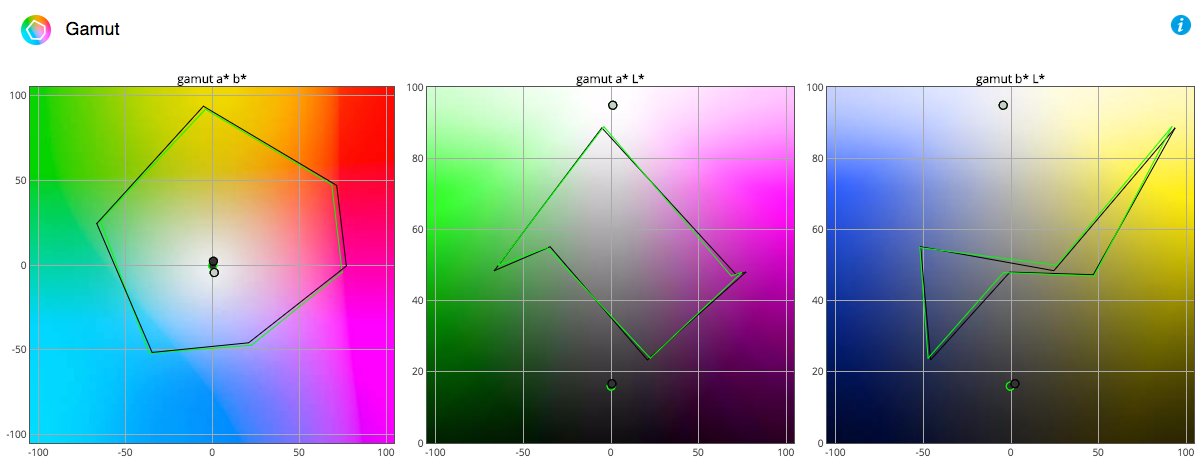
7. Gamut
Gamut plot is displayed for informative purpose only.Three planes (Top a*b*, and sides views: L*a*, L*b*) helps for measured (black) / target (green) values comparison.
A white and black points are displayed. Ideally a visual match is expected. Example 1 – high-quality offset/coated (E-Factor = 1,9)
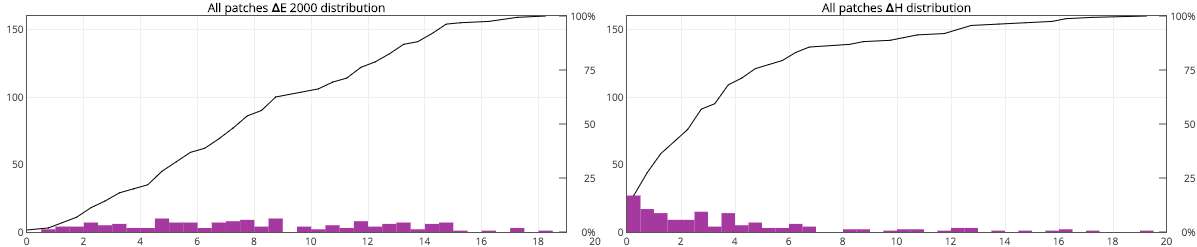
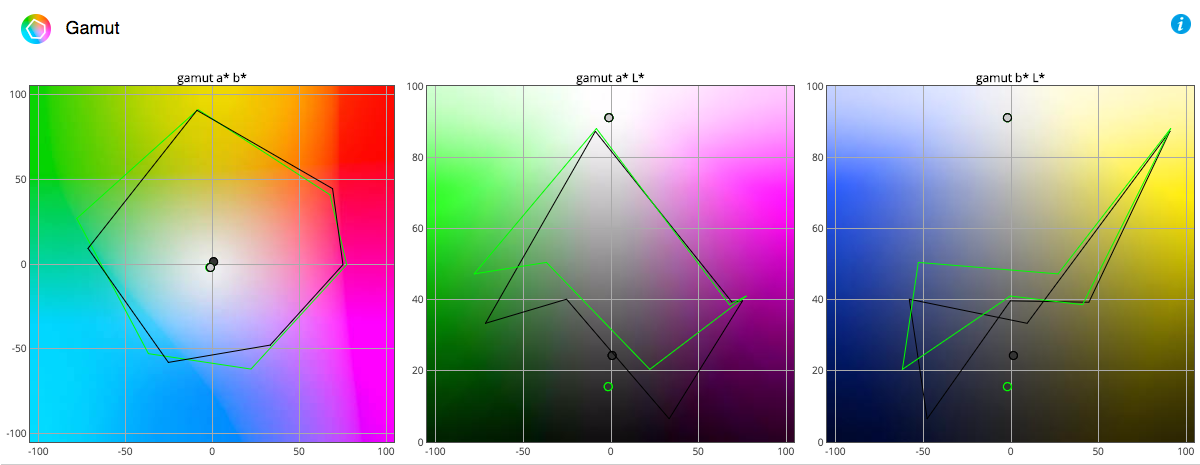
Example 2 – poor quality LFP (E-Factor = 15)
8. Ink GPS
Ink GPS is a practical tool for solving problems, whenever primaries are out of tolerances. Using math model a simulation ofink amount change is calculated. Several graphs help to understand which would be an influence of ink increasing / decreasing
on color accuracy (how close it can probably be to the Target value). This tool works based on ∆E 2000 formula only.
Ink trajectory. 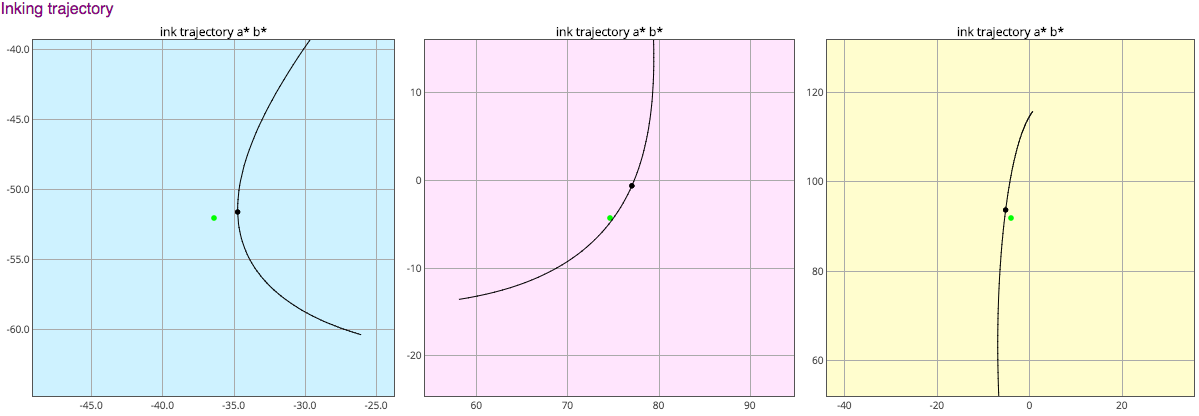
The graphs demonstrate path on which each inks approaching to, next receding from Target value (green point).
It is important to remember that real path is not flat, but 3-D, and the Aim point is also in the space.
It is very rare to achive a Target – and the question is not if it can reach it – but what is a minimal distance from.
In other words, what is the smallest possible ∆E?
Perifarbe
To answer this fundamental question – next graph called perifarbe shows the relationship between
optical density (for defined status) and distance from Aim ( ∆E 2000)
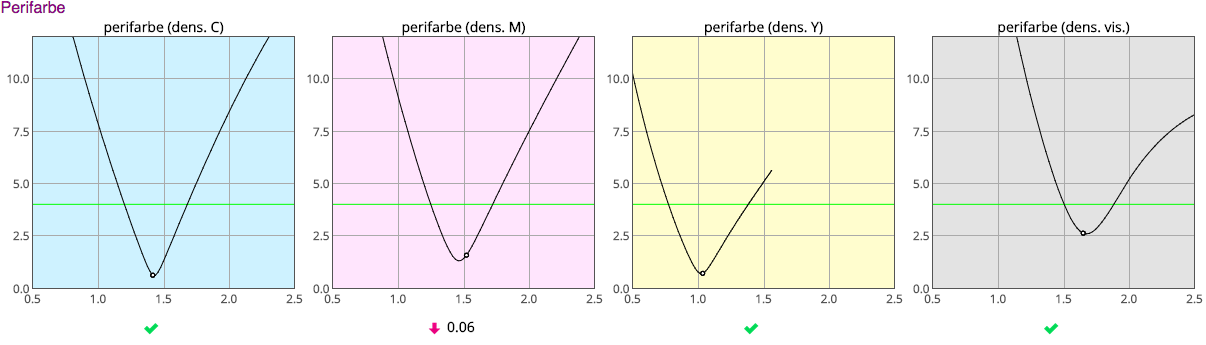
In this example, the only magenta should be decreased of 0.06 D to reach the best match.
Ink GPS error
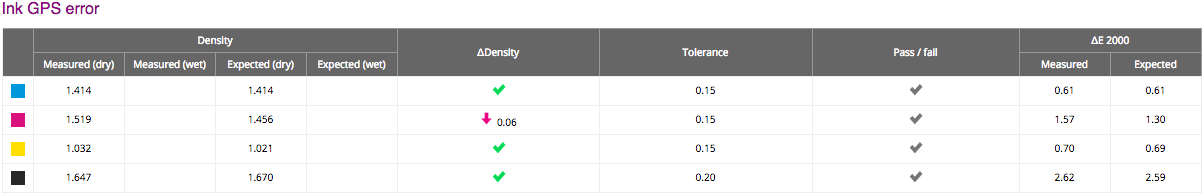 Finally, all predicted values are presented in the table.
If Dry-Back characteristic exists, values can take into account for the wet/dry correction.
9. Bullseye
The tool similar to Ink GPS – but dedicated not for experts but press operators.
The data are transformed so, that horizontal displacement means ink contamination, vertical wrong amount
to guide press operator how he can fix the problem.
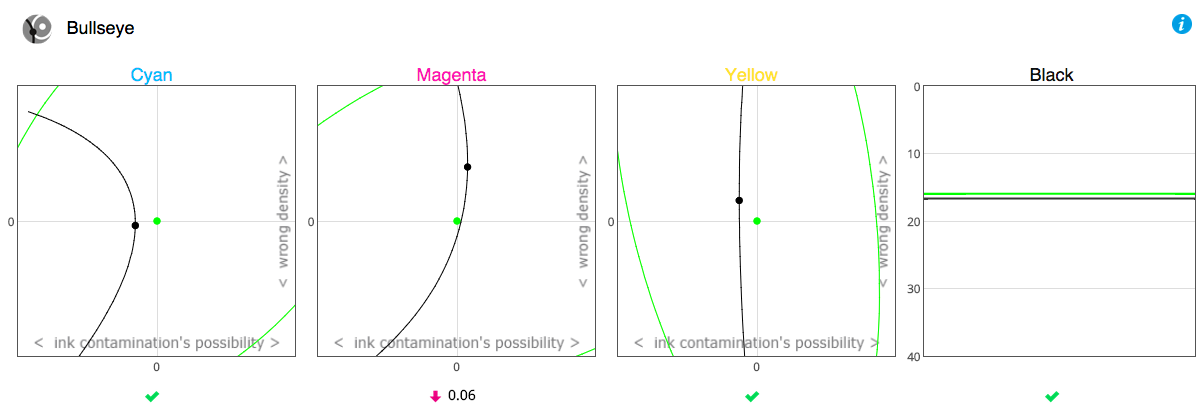
OK marks and arrows with density correction values guide to best match!
10. Tone Value Increase (Dot Gain)
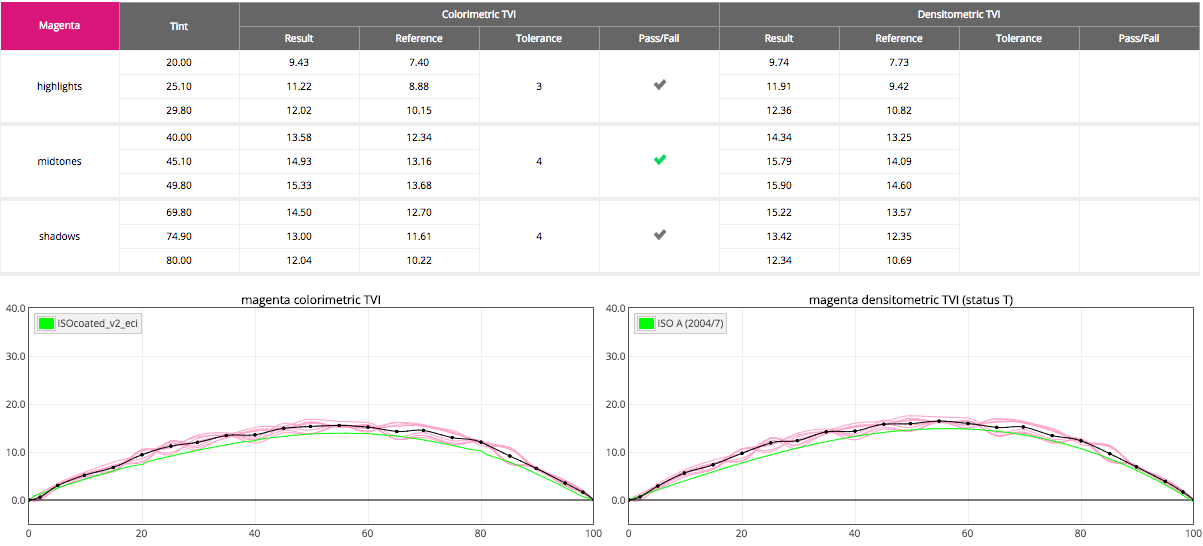
For the groups all curves will be displayed, visually showing the variations. The green line is the Target.
To use densitometric TVI target an ICC profile has to be described accurately (Profile Inspector)
CMY Spread
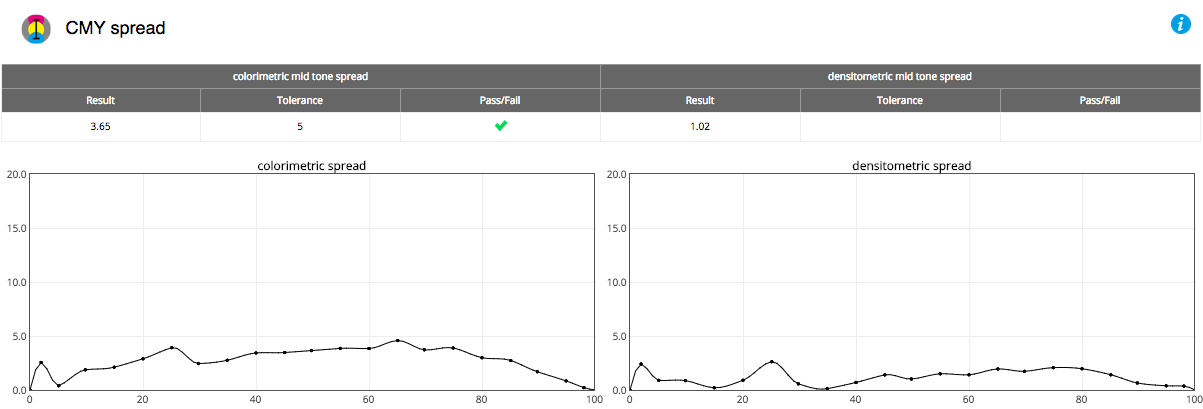
CMY spread is one of the parameters required by ISO 12647-2
and represents the maxim difference for all C, M and Y TVI curves .
12. Tone Repro Curves
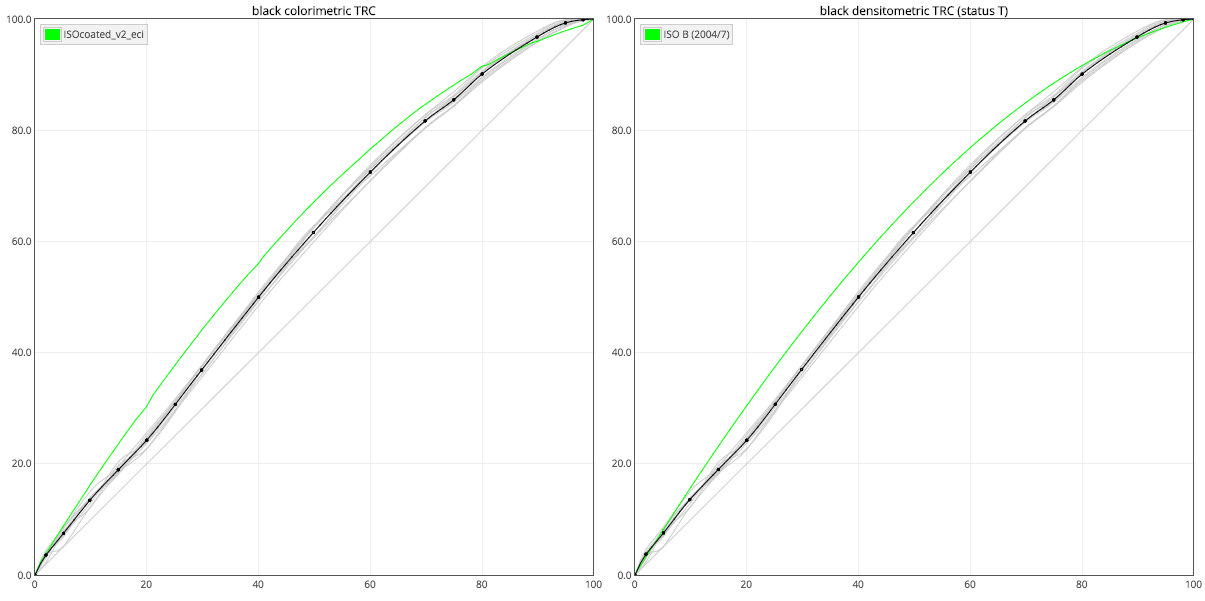
TRC curves display same data as TVI but in the another way (TVI start from zero and end with zero, TRC start same but end with 100%).
If variation of curves is acceptable (gray curves) then average curve (black) can be used for TRCA (Tone Repro Curve Adjustment) can be generated by Curve Inspector for the device calibration. The green curve represents Target.
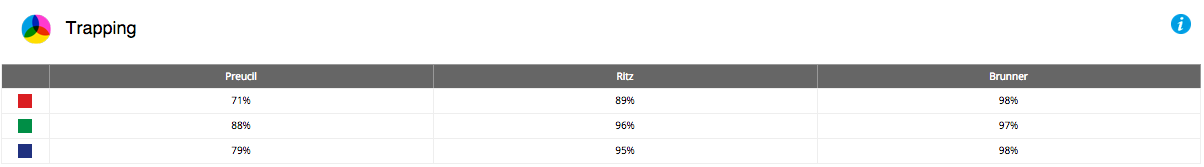
13. Trapping
System display trapping based on three formulas: Preucil, Ritz, and Brunner
14. Print Contrast

The print Contrast Value is calculated (75%).
15. G7® Conformance
The G7® Conformance is performed.
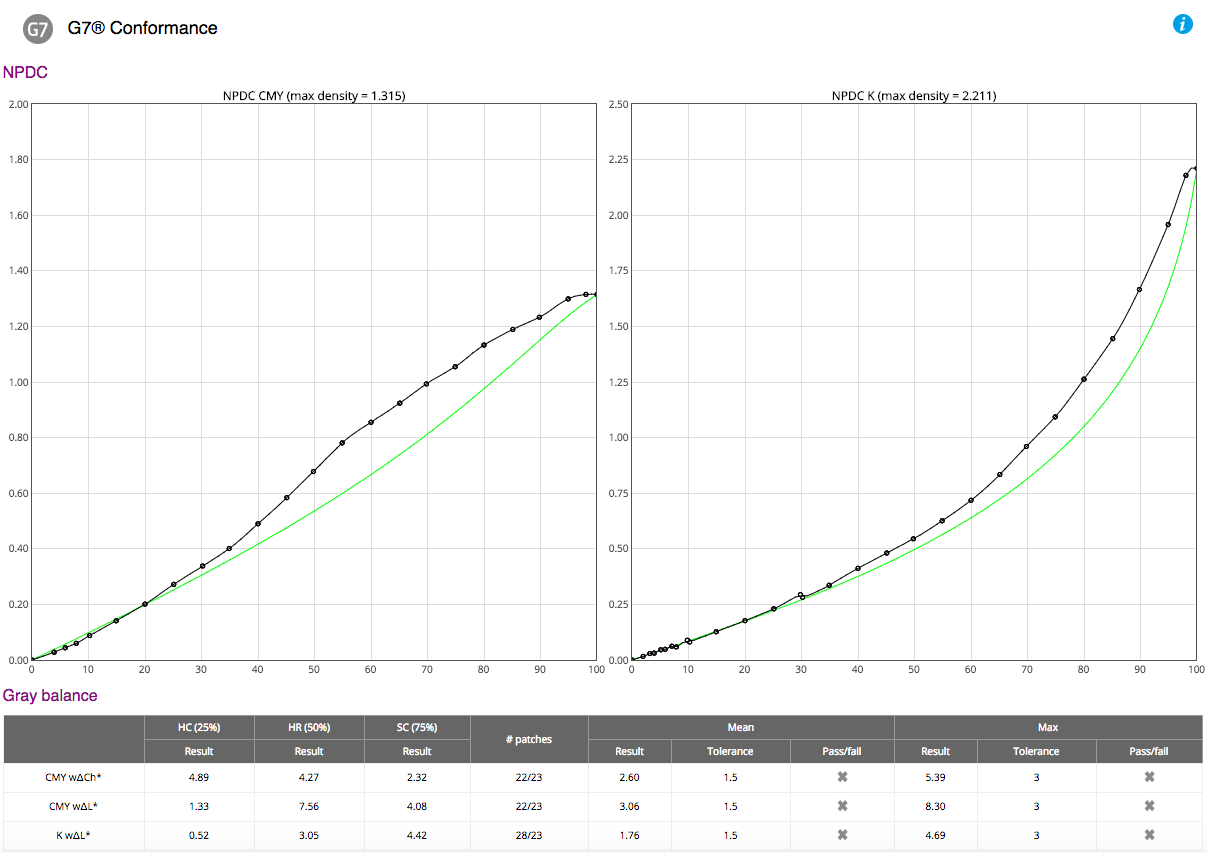
Both NPDC K and CMY curves are displayed.
Contact ChromaChecker Support
Additional information and Support Form is available for logged users.