Collecting and organizing measurement data
Systematic approach - the key to the fast and efficient analysis.
Goal: Naming convention that makes easy data grouping.
To understand let's explain the methodology
1. Naming example
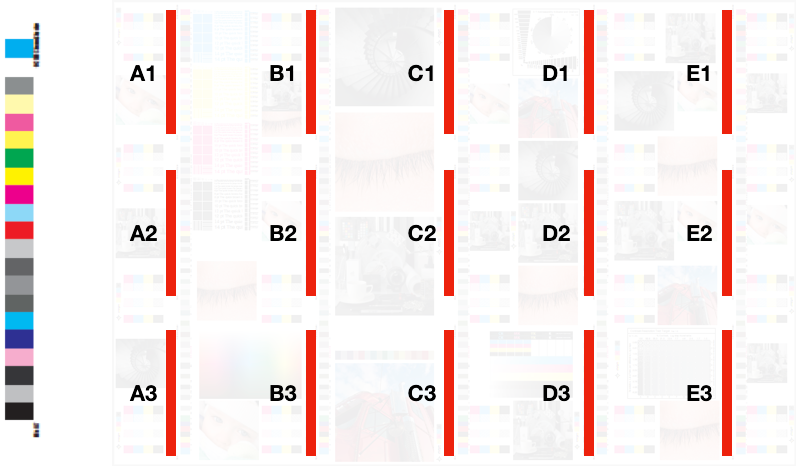
In this case, we have a layout of 3 rows and 5 columns
We can use the "Customer" description field (CC Capture) and assign a unique string to each measurement
A1 - where A stays column A and 1 is row number 1
A2 - where A stays column A and 2 is row number 2
...
E3- where E stays for column E and 3 is row number 3
2. Grouping and analysis
We can select all 15 measurements then create a group named: ALL
Group name ALL is perfect to create BASELINE. If we recalculate all measurements to this baseline we will be able to see which individual measurement deviation from the average
In the next step let's isolate 5 columns
Column A — A1, A2, and A3
Column B — B1, B2, and B3
Column C — C1, C2, and C3
Column D — D1, D2, and D3
Column E — E1, E2, and E3
and 3 rows
TOP — A1, B1, C1, D1, and E1
MIDDLE — A2, B2, C2, D2, and E2
BOTTOM — A3, B3, C3, D3, and E3
and logical
RIGHT — A1, A2, A3, B1, B2, B3
CENTER — B1, B2, B3, C1, C2, C3, D1, D2, D3
LEFT — D1, D2, D3, E1, E2, E3
At this moment we can focus on groups only - Print Inspector enables filtering data to groups only.
As all groups are created with analysis to Baseline we can quickly detect if higher deviations are located on the LEFT, CENTER, or RIGHT, TOP, MIDDLE, or BOTTOM.
- High deviations suggest an additional analysis of slurring/doubling issue - dedicated test S/D patches help detect a problem. For more accurate results use spot measurement mode!
- Left-Center-Right deviations might be caused by improper ink key adjustments
- Top-Bottom deviations can be sometimes fixed by ductor adjustments
- Cylinder centering, nip pressure measurements, blanket thickness checking, grips verifications, and similar procedures are typical tasks on the troubleshooting checkpoint list
Important elements of analysis
1. Variations for solids and tints
2. TVI curve variations
Steps of the analysis
- We start from within-sheet variations
- Some presses have double size impression cylinder - two active sections are working in this case - it is important to test two sheets in the row for such presses
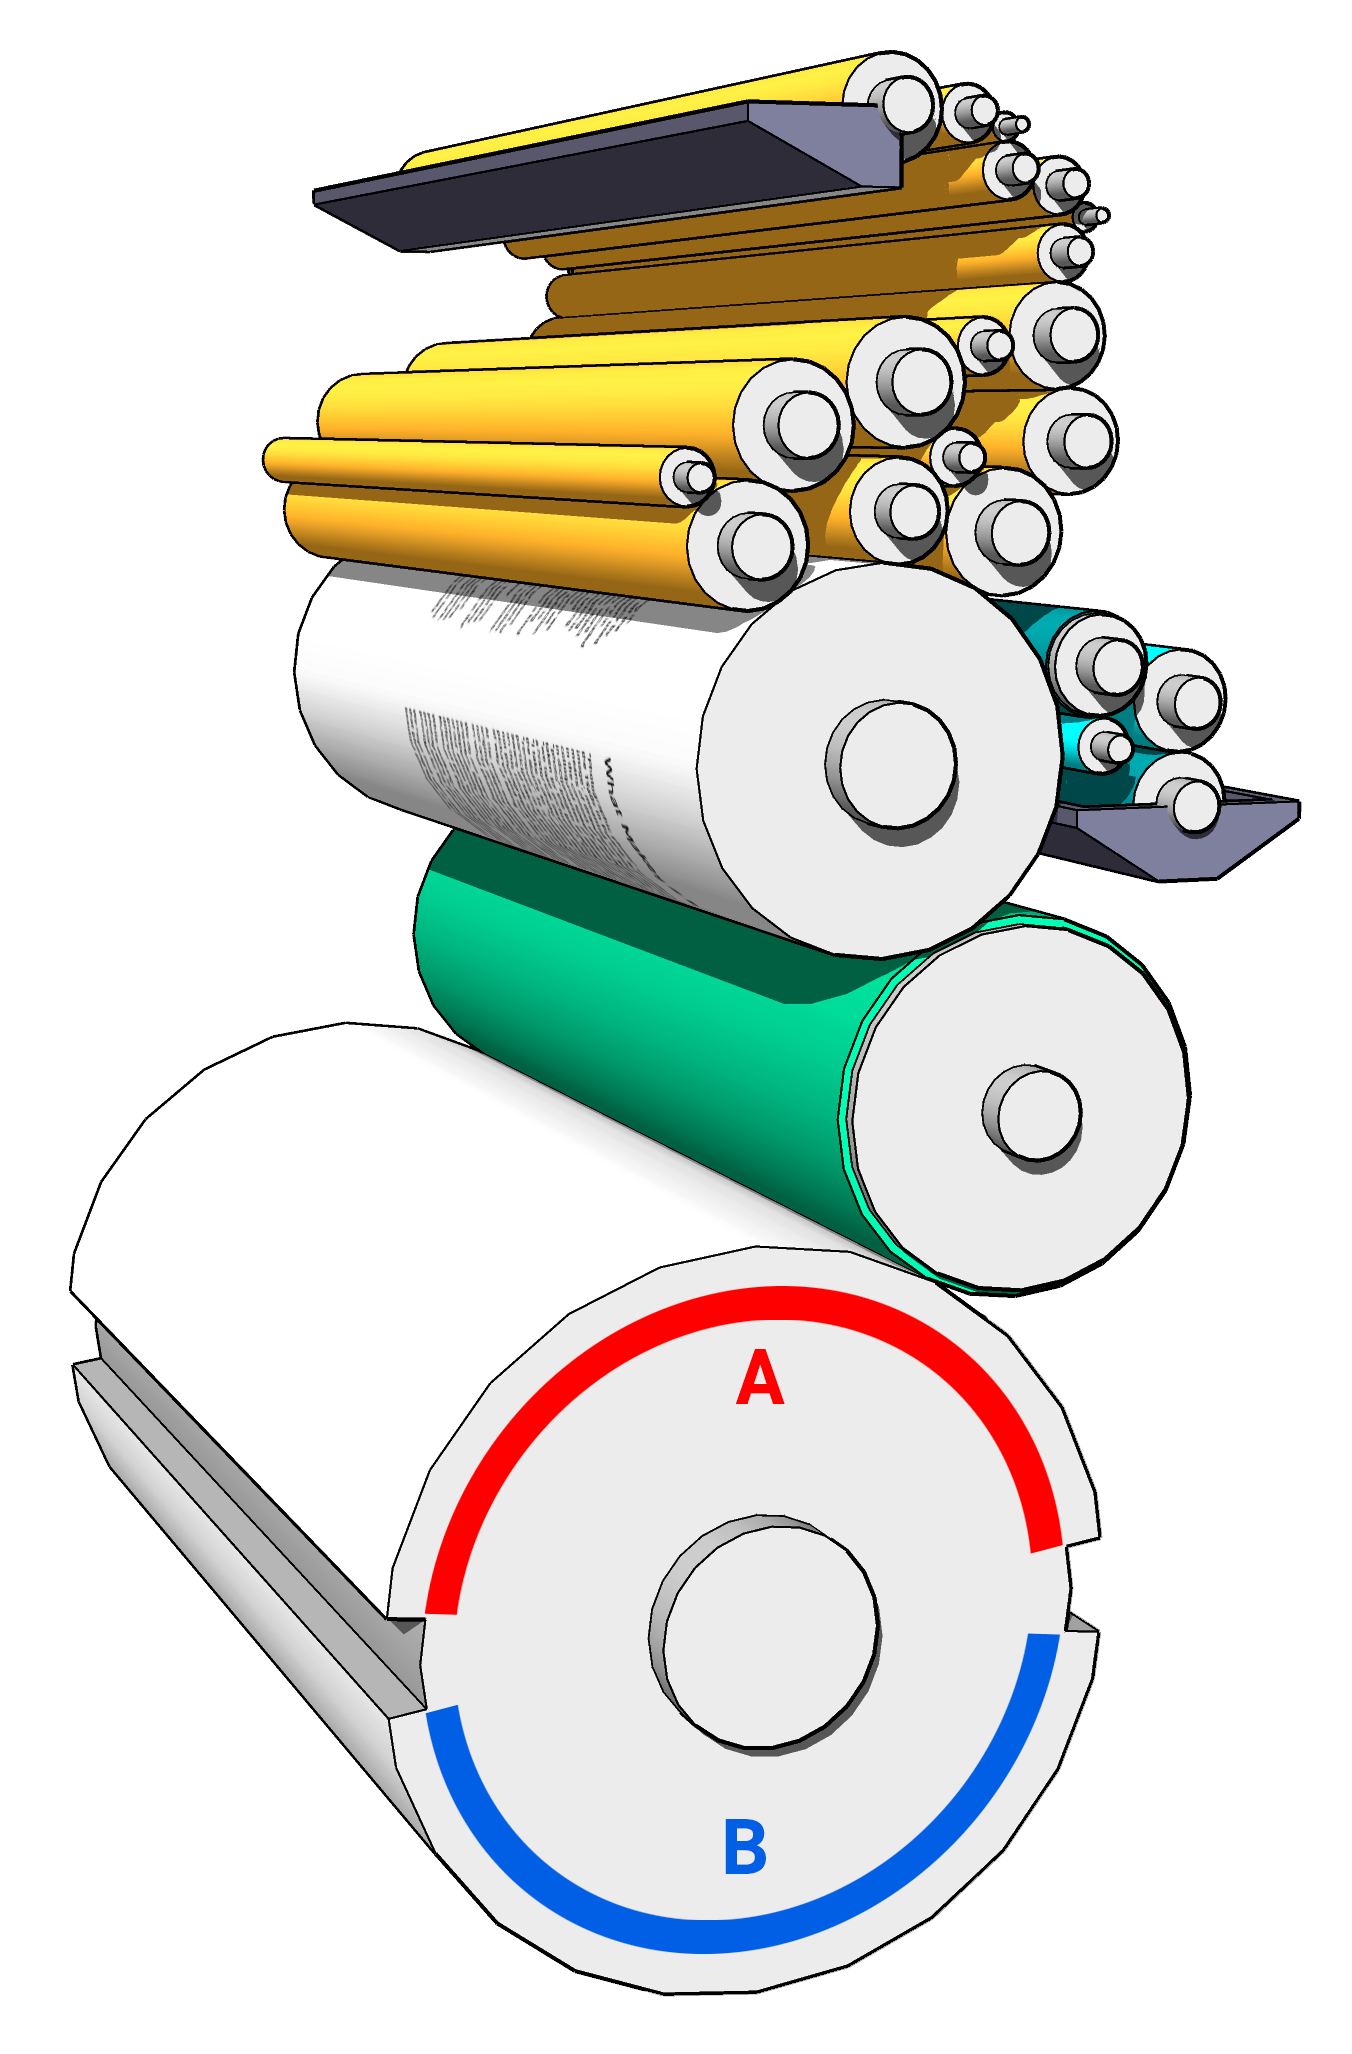
Blanket and plate cylinders are smaller than impression one. The impression cylinder has two sections marked with "A" and "B" on this diagram. If we detect regularity in deviations when comparing sheets pressed by sections "A" and "B" - it is probably a mechanical issue — check if cylinder is centered properly. - We can repeat the test for more sheets selected for the intra-sheet test
- When these tests passed - the next step is to group the same control strip location or group of locations based on print run representation ( sheets 1, 101, 201, 301, 401, 501.. 901) or in case of double size impression cylinder sheets 1,2, 101, 102, 201, 202, 301, 302...) and watch the numbers
Depending on the type of the press, the number of units benchmarking - even for new presses may take days, even weeks. Tighten tolerances are obviously more challenging. It is pretty rare that all test passes at the first attempt. In most cases, some consumables have to be changed to get expected results and a lot of mechanical interventions have to be performed.
The whole procedure seems to never end however the numbers prove huge improvements in most cases. Sometimes some mechanical components have to be replaced and it happed even in the case of brand new presses after transportation from the factory. Modern printers are very complex and it always takes time to tune them.
Barcode Automatisation
We are showing how barcodes can help you with automatic measurement descriptions. Please consults the manual and follow the description on how it can be implemented in the case of Test Form1. Not only it is easy to identify the location on the sheet but also it is easy to create unique labels to recognize each measured sheet (Job ID field).
Smart plan - fast work.
Measurements are typically the most time-consuming part of the analysis. Think about how to organize work not to repeat any measurements. The key is the proper description. Do not try to measure wet sheets - wait, make them dry, don't forget about backing, and be sure that the table is flat and big enough to perform.
Make one test before you start another. You may want to ask technicians to perform some adjustments - so be patient and do not plan too much for a short time. Finally
Contact ChromaChecker Support
Additional information and Support Form is available for logged users.