Grid Options
Grid is available from the ChromaChecker Capture interface or from the Operator interface from the Cloud Login. Cloud login provides more flexibility, but the CC Capture interface is easy to access.

Purpose of using the Grid feature.
If we need to see what samples similar to a measured or loaded sample look like, we can generate a set of examples based on a defined deviation range and the number of steps in each axis. Based on the Lab space, we can set the size of a single step in each axis, as well as specify the number of steps separately. This will create one or several pages illustrating similar variants. Using the descriptions, we can make visual corrections. There are several scenarios, but typical applications include:
- Finding the CMYK or Lab coordinates of the color we're looking for when we don't have a perfect sample.
- Searching for a color that reproduces "better."
- Seeing potential differences that a color will experience during reproduction.
This tool is intended for visual verification, but it can also be used to measure a specified area as a reference. It is suitable for evaluation on screen and in print. Still, you should first check whether the color is within the gamut and either perform a precise monitor calibration or use "Start Color Match" to iterate the printer's LUT to ensure exact printing.
Understand Grid parameters.
PDF Color Space
The created file may address graphic objects using various color spaces, such as Lab, CMYK, or RGB. This requires understanding the details of your production workflow. If you are using an inexpensive SOHO printer, it is probably using a generic system driver that uses the RGB color space. If you have a printer with a RIP (for example, an Xerox MFP with EFI Fiery, an Epsonproofer controlled by the RIP, or a Konica Minolta KM-1e Press), it is mostly CMYK.
Color Depth.
If your system can handle 16-bit - use it for more accurate addressing. Inexpensive solutions are often 8-bit only, while more advanced ones can use deeper color definition.
PDF Sample Descriptions
Each sample is described - you may select Lab or the color space chosen for PDF.
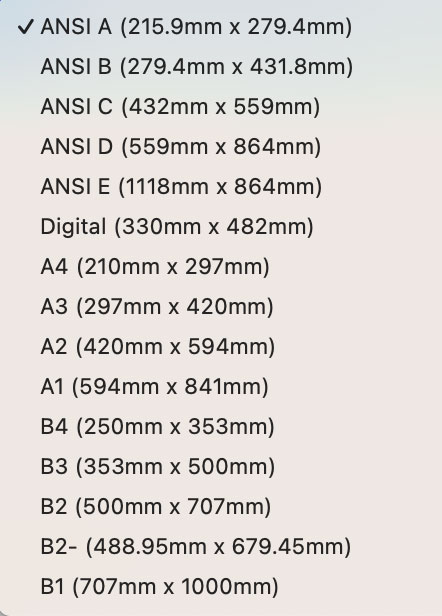
Media Size
This defines the media size of the PDF.
Examples
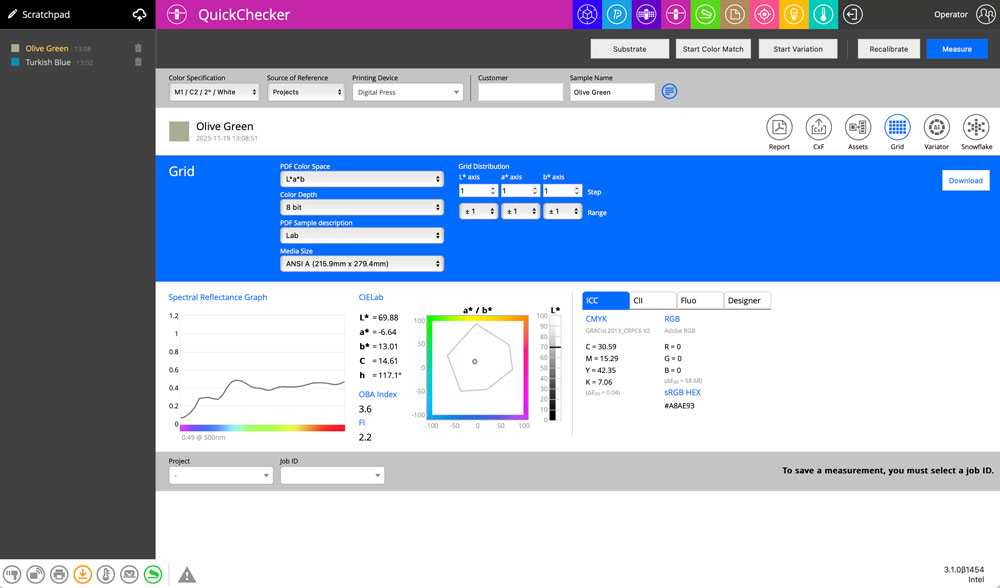
Sample 1
Settings chosen:
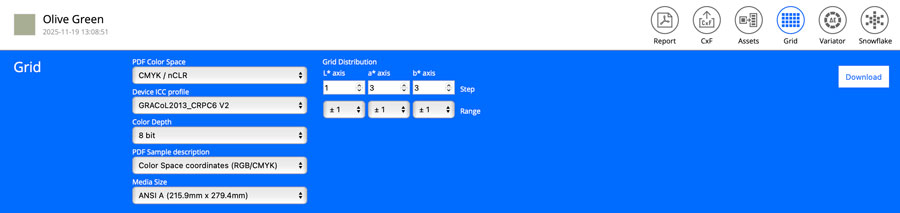
Steps in axe a* and b* are coarse (=3), whole for L step is fine (1).
Selected GRACoL color space, with sample description based on CMYK coordinates.
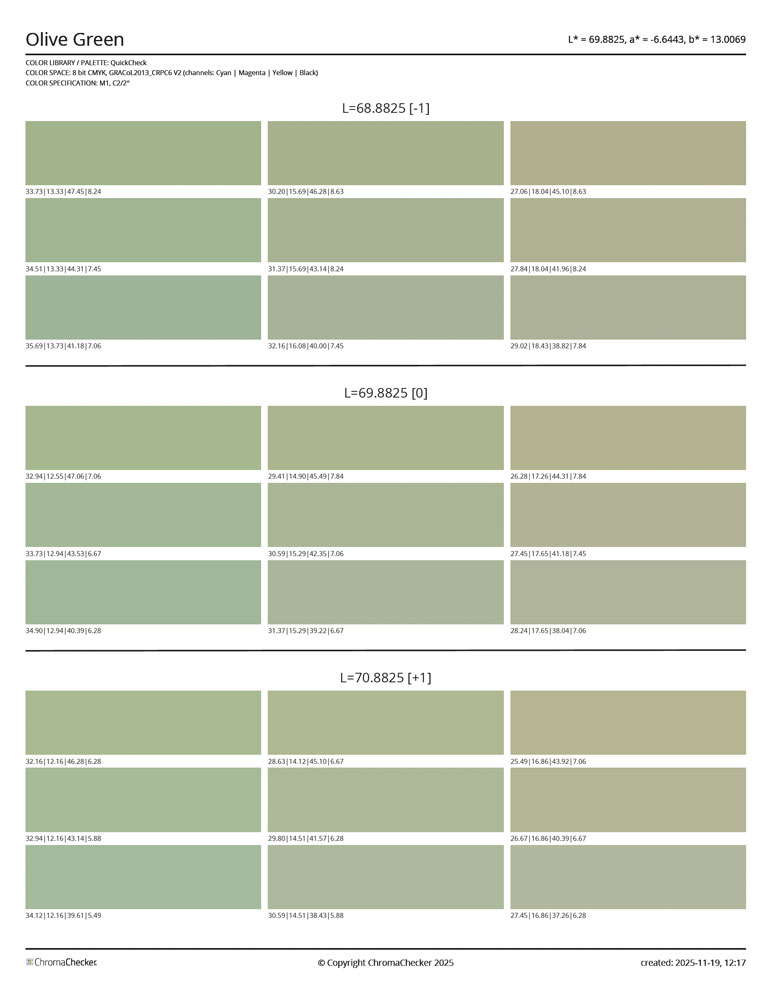
Minimal grid layout - all samples are on a single PDF page.
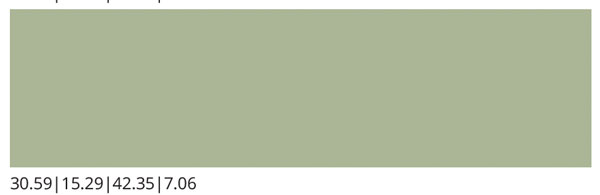
Notation below means: C=30.59%, M= 15.29%, Y=42.35%, K=7.06
Click to download this sample file. 
Please note
If you need a sample with a different Black Generation, select an ICC Profile that meets the expectation. Use No black generation or Max Black Generation to control the K component.
Settings
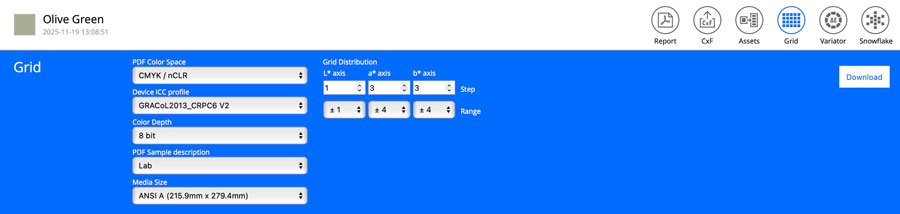
In this case, the range is for axes a* and b*, which are set to ±4, and the description is set to Lab.
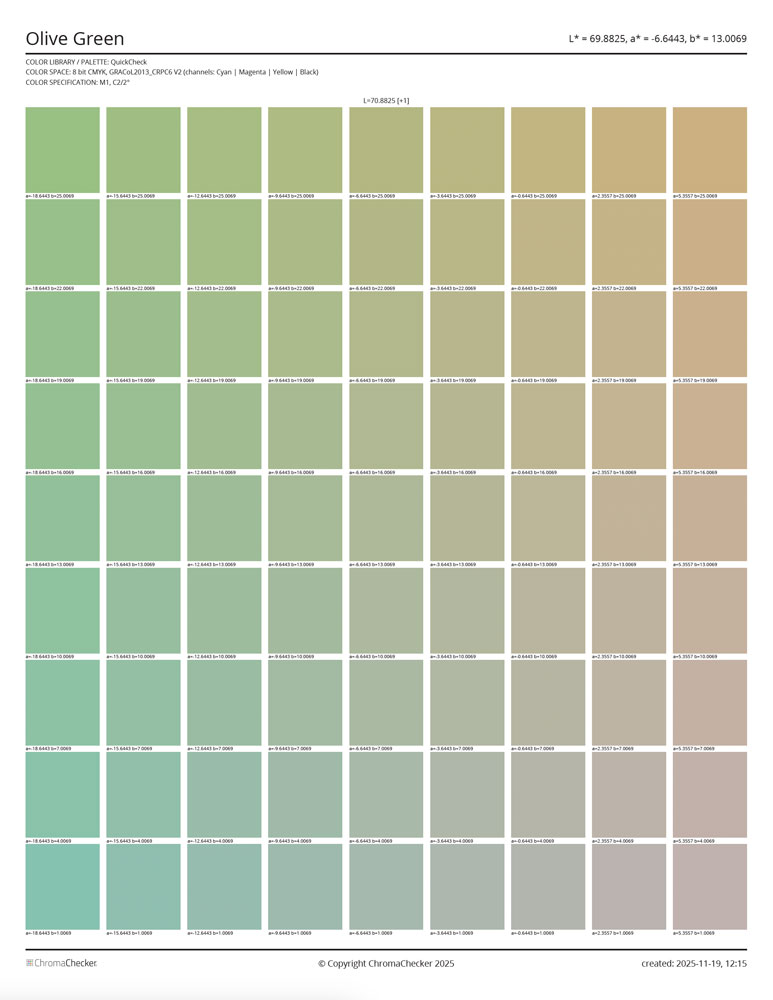
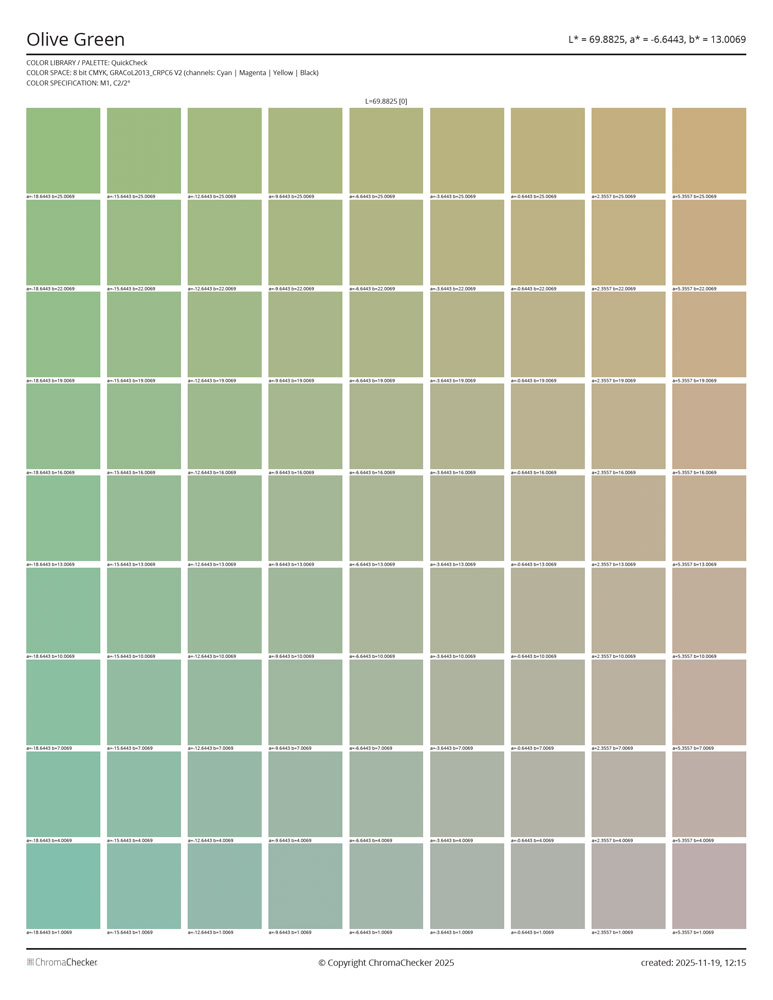
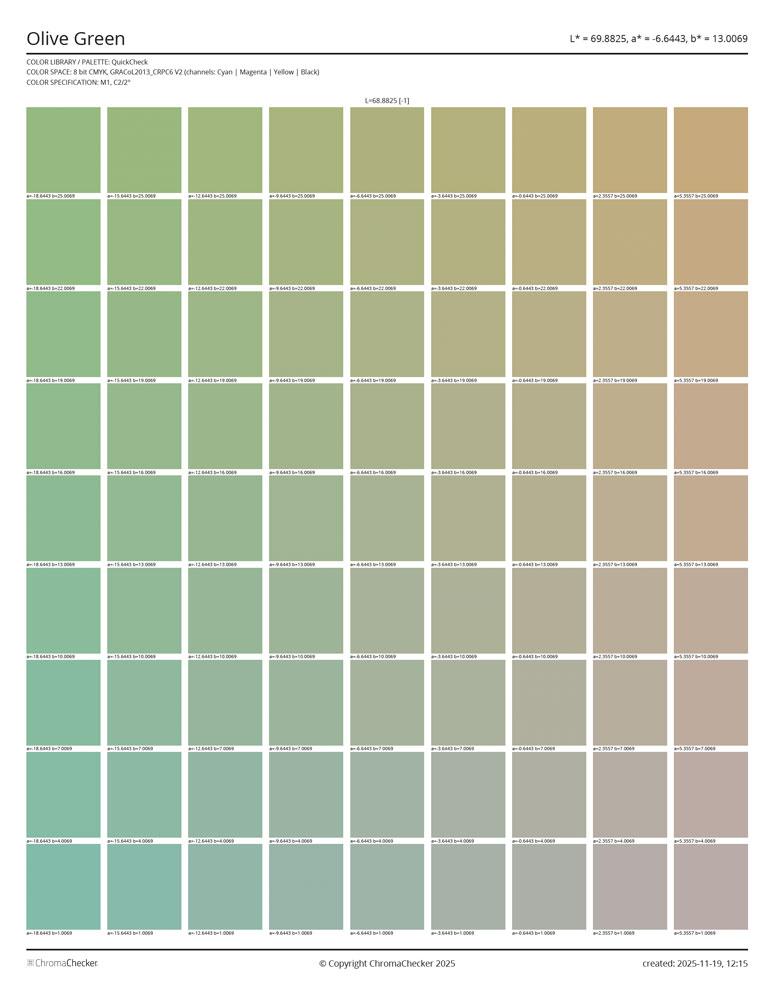
Three pages are generated.
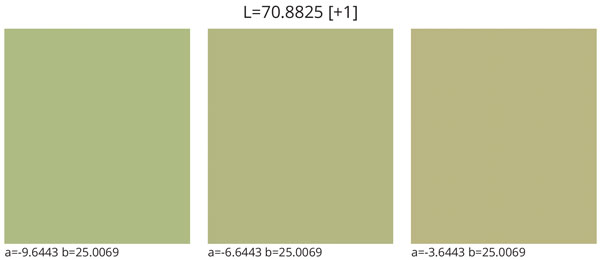
Samples are described with Lab values.
Please note:
Please understand that the general space for this PDF is CMYK - NOT Lab, as calculated and might not be accurate. Using the CMYK color space provides LUT-based printing capabilities, whereas Lab PDF space requires a perfect proofer to reduce real-world variations.
Click to download this sample file.
Video
Contact ChromaChecker Support
Additional information and Support Form is available for logged users.