Introduction to QuickChecker Interface
Capture's QuickChecker interface offers a straightforward way to measure, compare, and track colors. The interface is designed to allow immediate reading in a scratchpad area and store master color reference tracking of colors in the ChromaChecker Cloud. Measurement data can be displayed and stored in various ways to meet your production needs.
The key components of the QuickChecker Interface are:
| Scratchpad | 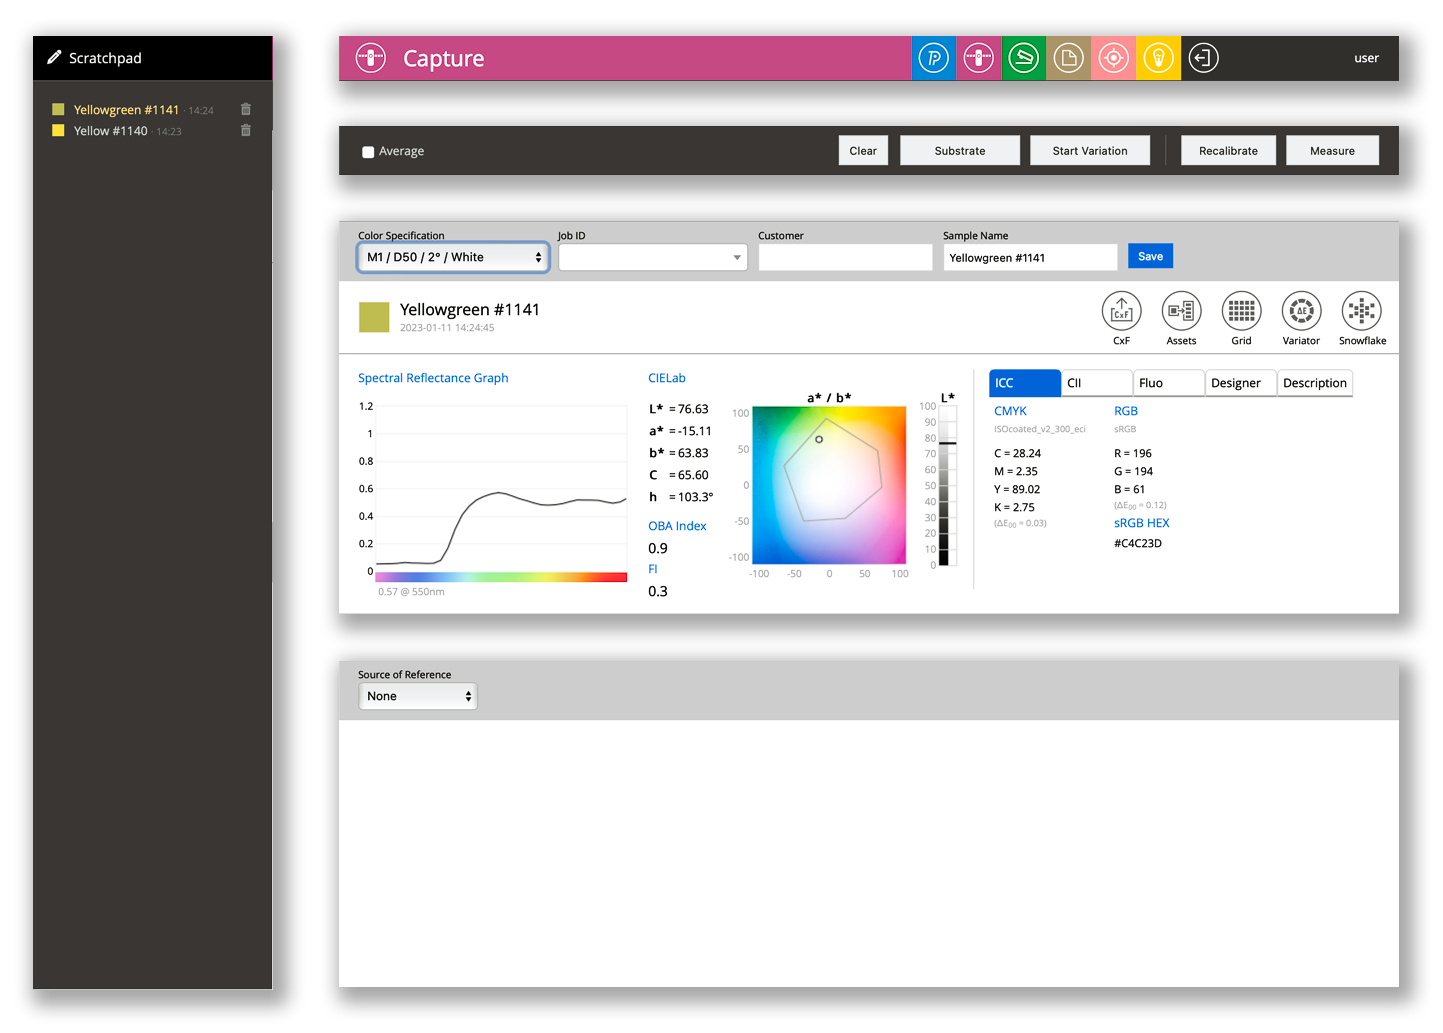 |
Inspector's Bar |
| Action Bar | ||
| Measurement Report | ||
| Compare Report |
ChromaChecker Capture - QuickChecker Interface
ChromaChecker Capture is a Mac/PC application designed for operators, and QuickChecker is one of the tools available within it. It's beneficial for handheld instruments.
Summary of Interface Elements:
- Main Menu (Right Side): Features buttons organized into groups.
- Scratchpad (Left Column):
- Stores measurements from the last 24 hours.
- Allows you to return to previous measurements for comparison.
- Has an import icon for loading measurement files in CxF format [i].
- Top Menu (Blue):
- Measure Button: Triggers a measurement [i].
- Calibration Button: Initiates instrument calibration [i].
- Special Function Buttons: Substrate, Start Color Match, and Start Variation (which we'll cover later) [i].
- Light Gray Bar: Located below the top menu, it contains various options that we'll explore [i].
- Measurement Display (Upper White Field): Shows the measurement using a spectral graph and other data [i].
- Color Sample Square: Displays the measured color, accompanied by a name assigned by the system that you can modify [i].
- Icons: Allow you to create reports or export data [i].
- Spectral Reflectance Graph: Shows wavelengths reflected by the measured object [i].
- Colorimetric Coordinates: Digital values and graphical representation [i].
- OBA Index and Fluorescence Index: Parameters related to fluorescence [i].
Scratchpad
The Scratchpad (left side of the screen) provides a working space where all measurements from the last 24 hours are displayed. The measurement selected (highlighted with YELLOW) is presented in detail in the Measurement Report. On the right side of the measurement, the trash can icon enables permanent deletion - any measurement made incorrectly can be easily removed. All measurements on Scratchpad are deleted after 24 hours; if you want to save, then save to the library or job, or export CxF.
The Operator can select any measurement to see the related Measurement Report.
All measurements are auto-named, but the user can override the proposed name. The name of the color sample is supplemented with a serial number to facilitate navigation.
The "Substrate" and "Start Variation" functions create different types of data, with varying reports of measurement and names corresponding to the applied tool.
Important notes:
- Measurements displayed are relative to the connected instrument only and will clear if the instrument is switched out. Multiple instruments can be used if the measurements are saved and tracked in the ChromaChecker Cloud.
- If you need to reference measurements, save them to Assets (Palette or Library) or export to a CxF file.
- QuickCheck offers an autosave function and utilizes the trash icon to delete measurements, but only for a limited period.
Inspector's Bar
This is where the Operator selects which CC Capture Inspector they want to use.
Notes
- If you want QuickChecker to be the default tool for Operators in your Organization, assign them as Team members with such a default setup in Accountability Inspector.
- The Operator can only access Inspectors for which they have rights defined within the Accountability Inspector. CC Champion can simplify the Capture interface so the Operator only sees options relative to their needs.
Action Bar
The operator selects what and how samples will be measured.
| Triggers regular measurement. With most instruments, this button is the same as pushing the measure button on the Instrument. | ||
| Calibrate/Recalibrate button enables invoking the instrument calibration process on demand. It makes sense to initiate recalibration if a critical reference is about to be created. | ||
| This option allows a series of measurements of the same sample to quantify uniformity (homogeneity) and create spectrally averaged references | learn more | |
| If the measurement has to be evaluated in relation to the Substrate (density calculation, paper, textile, ...), the Substrate measurement should be made first. | learn more | |
| Some advanced features use previous measurements (Job ID, Customer, Project,...). This button is used to reset settings. Proper function when working with Projects | ||
| Average checkbox | This is an alternative method for creating averaged data. Using this option, only averaged data are sent to the server. No access to any individual measurements allowed | learn more |
| other options | Some instruments have specific options - they will be displayed here. |
Measurement Report - Setting (gray bar)
For more advanced tasks additional descriptions or color specification selections might be necessary for future analysis. Description fields are optional.
| Instruments can offer different M-conditions and other settings. Spectral to colorimetric value conversion requires Illuminant and Observer, and final values can be very different! | learn more | |
| This description is optional. It can be used for filtering data by Job ID, which is required for Projects. Instead of manual input, a CC-2D barcode reader can be used to record JobID. | 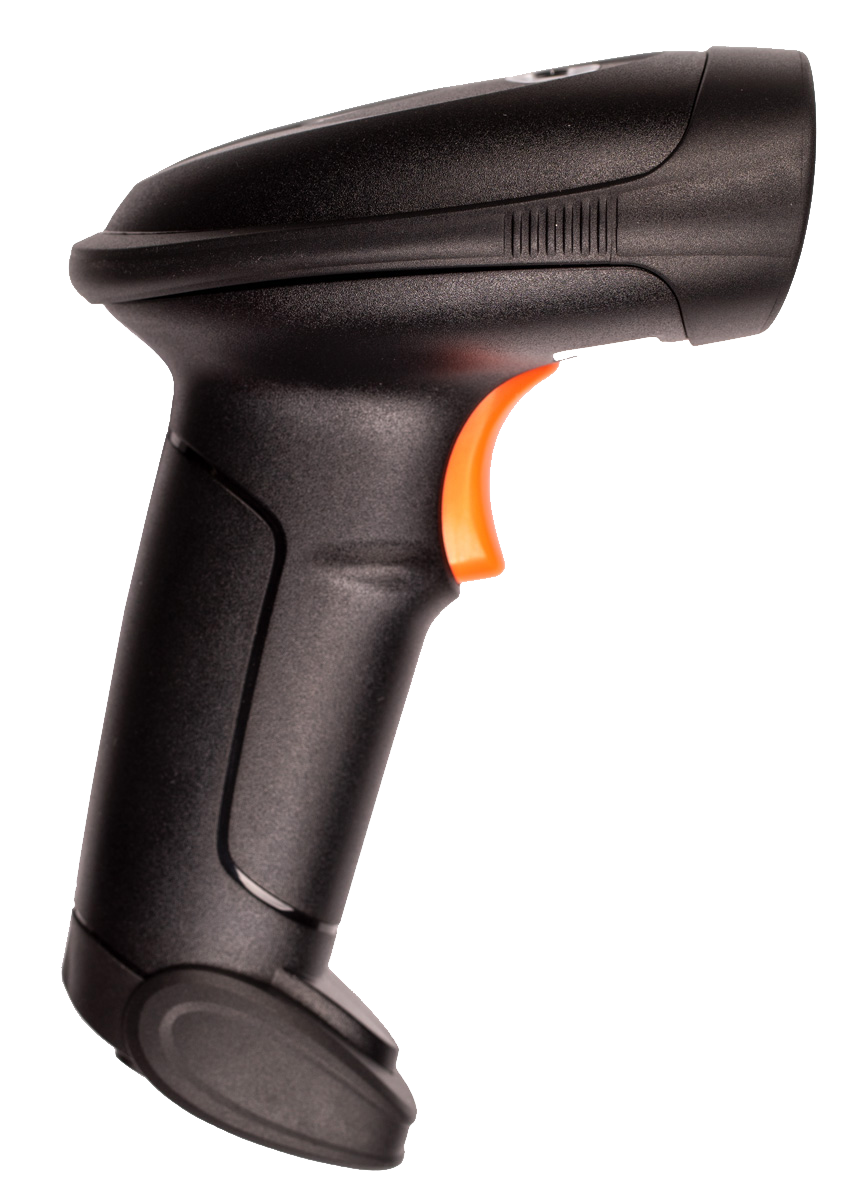 learn more |
|
| This description is optional. It may be used for filtering data by Customer, which can be useful. Instead of manually inputting, a CC-2D barcode reader can be used to capture customers. | ||
| For regular measurements, QuickChecker is suggesting plain English names with sequential numbers. The Operator can change default name to any name. Using ChromaChecker Custom Instance, it is possible to use a custom auto-naming system. |
Important notes
- CC Champion can edit and add to the list of Color Specifications that are available - If Custom Lighting is desired to be used for sample evaluation (useful when matching specific color in custom lighting area) - a custom Color Specification has to be created with the custom light.
- Both the Job ID and Customer description fields can be automated using bar codes. Additionally, Project selection can be automated using barcodes.
- Sample Names in the case of Projects come from the Project definition.
Measurement Report - Result
The report uses the Color Specification setting to calculate colorimetric coordinates. If Instruments enable Multi-M-condition measurements (or function is enabled by the Operator) - once measured, the user can switch Color Specification and see how he numbers change per different M conditions.
When the "Measure" button is triggered, a typical report looks like this:
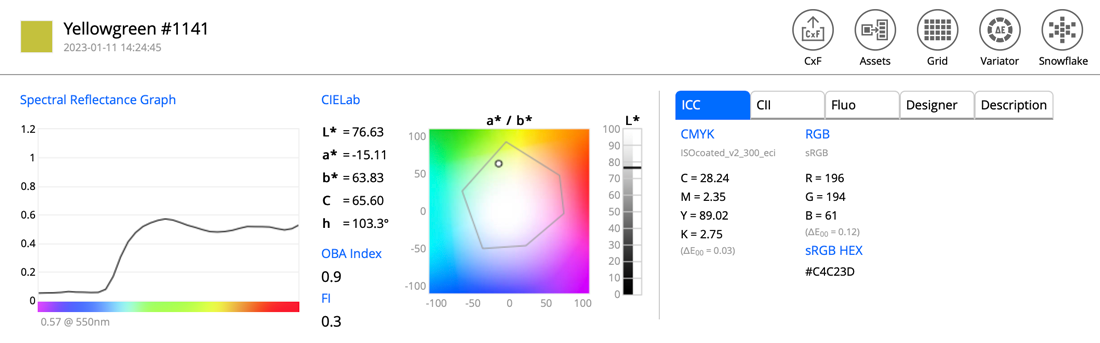
The detailed Measurement Report explanation is split into the following scenarios - select one to continue
- Basic measurement - the result of hitting the "Measure" button
- Substrate measurement
- Start the Variation function
Notes
- On the right side of menu, some tools makes additional calculations possible. To learn more, click on the icon below to get detailed information.


CxF Assets Grid Variator Snowflake
Compare Report - Setup (gray bar)
To compare the Sample, a Reference has to be selected. The following options are available:
- Assets (Color Inspector palette or Library)
- Print Inspector
- Scratchpad (any last measurements)
- Projects (QC Tracking)
- CMYK/nCLR
- L*a*b*
These provide multiple sources for Reference data to compare against, many of the options provide a best match selection.
Compare Report Results
The following example uses the ChromaSpot Color Library as a reference.
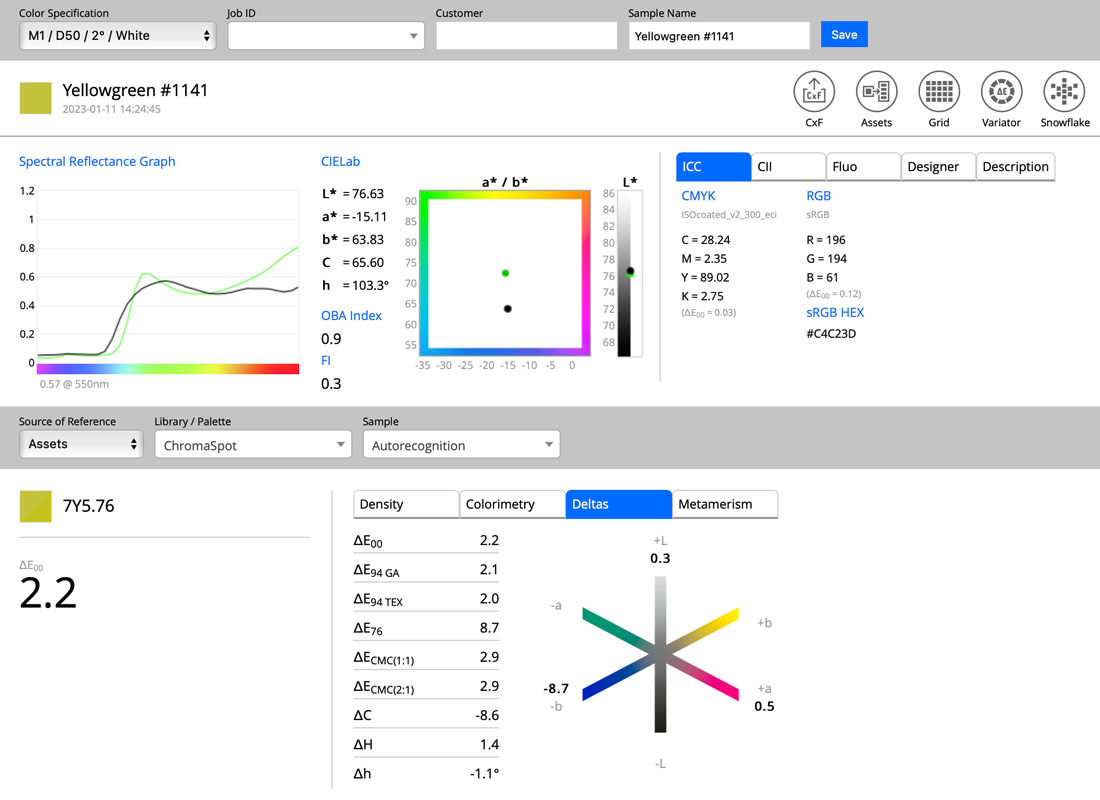
Notes
- Set the Source of Reference to Scratchpad to get an instant comparison to previously measured samples.
- Both reference and sample need to have the same M-condition data - otherwise, no comparison is possible.
- In the Measurement Report, a green spectral curve represents the Reference. The Metamerism Tab shows the spectral difference.
Video
-
How to find the best match to any color sample, physical, or Lab, or Library colors.
-
How to Match Color and Set Spot Tolerances
Second Tuesday Seminar - February 13, 2024 -
Second Tuesday Seminar - May 14, 2024 — We have Certified ChromaChecker consultants who can come to your site or provide remote consulting services to help you integrate spot color matching in your workflow.
Related Topics
Contact ChromaChecker Support
Additional information and Support Form is available for logged users.