Start Variation - measure more accurately
Start Variation is a unique tool that analyzes sample uniformity. By hitting the "Start Variation," a series of measurements is open. Until the "Stop Variation" button is pressed, all color samples will be compared one to another. Each individual pair of measurements will be taken into general statistics. This part of the analysis is not focused on any reference but on the uniformity of color samples only. Finally, the data are averaged, but the user can see several parameters that accurately describe how uniform the physical sample is.
This tool is dedicated especially for:
- Creating Color Standards
- Tracking QC in Projects - where QC workflow requires within-sheet uniformity
- Analyzing within the sheet or in between sheet uniformity of any color - a critical part of most audits
- Checking uniformity of paints and coating and any color manufacturing or postproduction processes (it can measure spectral glossiness based on SPIN/SPOUT measurements)
Notes
- Use one color sample at one series -during this test, the autorecognition function is using the averaged value - no way to track more than one reference.
- Any sample that is measured accidentally can be deleted without breaking a series of measurements.
- Autosave function for Projects can store each measurement - the user may use it for additional within-sheet analysis without needing to remeasure samples again.
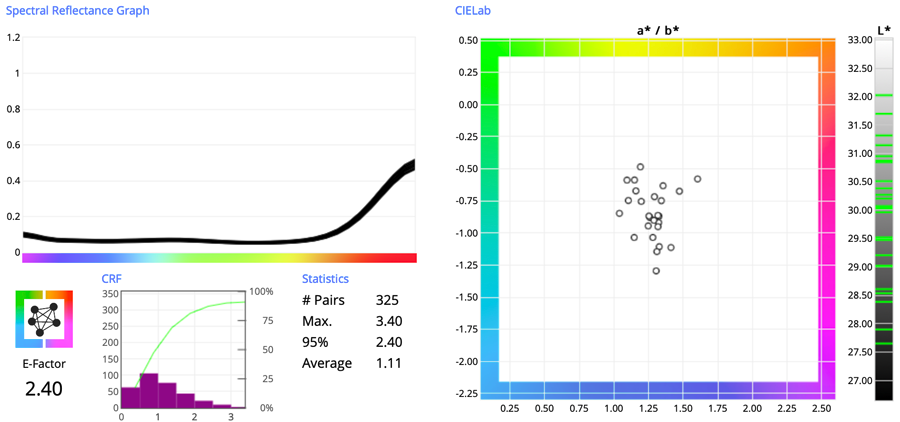
Understanding Statistics
|
 |
Heatmap Report — measurements ordered based on 3x3 or 5x5 layout.
When 9 (3x3 or 25 (5x5) measurement in series is taken QuickChecker generates an additional Heatmap Report. This is very useful if information about within-sheet uniformity has to be extended to the evaluation where on the sheet the error is highest. Some printing technologies make it possible to fix left-to-right or top-to-bottom uniformity issues. It might be useful for any manufacturing technology - knowing the problem is the first step to fixing it.
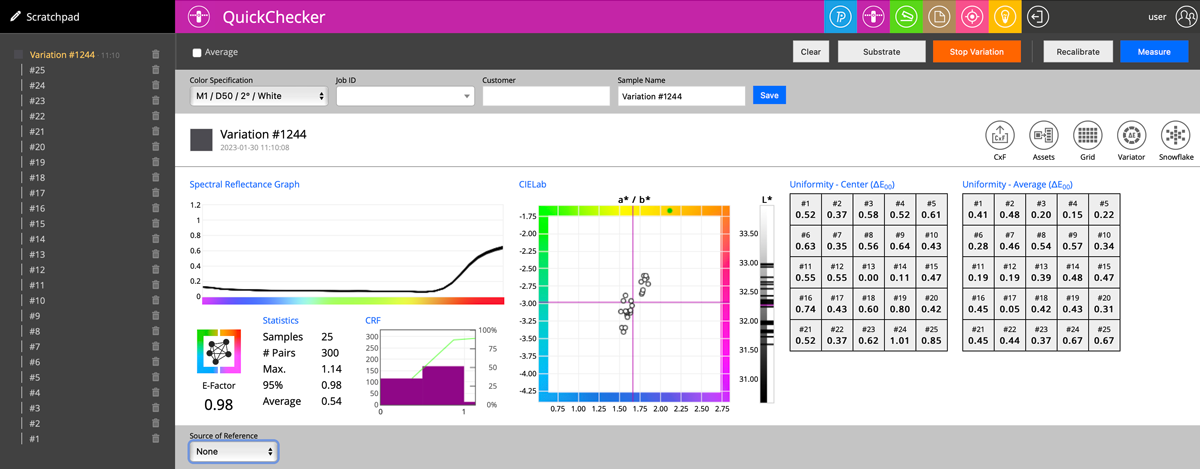
If no Source of Reference is selected then two heatmaps are generated and evaluated
- to the current average and
- to the location in the very center of the sheet
When the Source of Reference is defined - evaluation is to this Reference
In this case, two options are available - calculate the result to:
- Last Measurement:
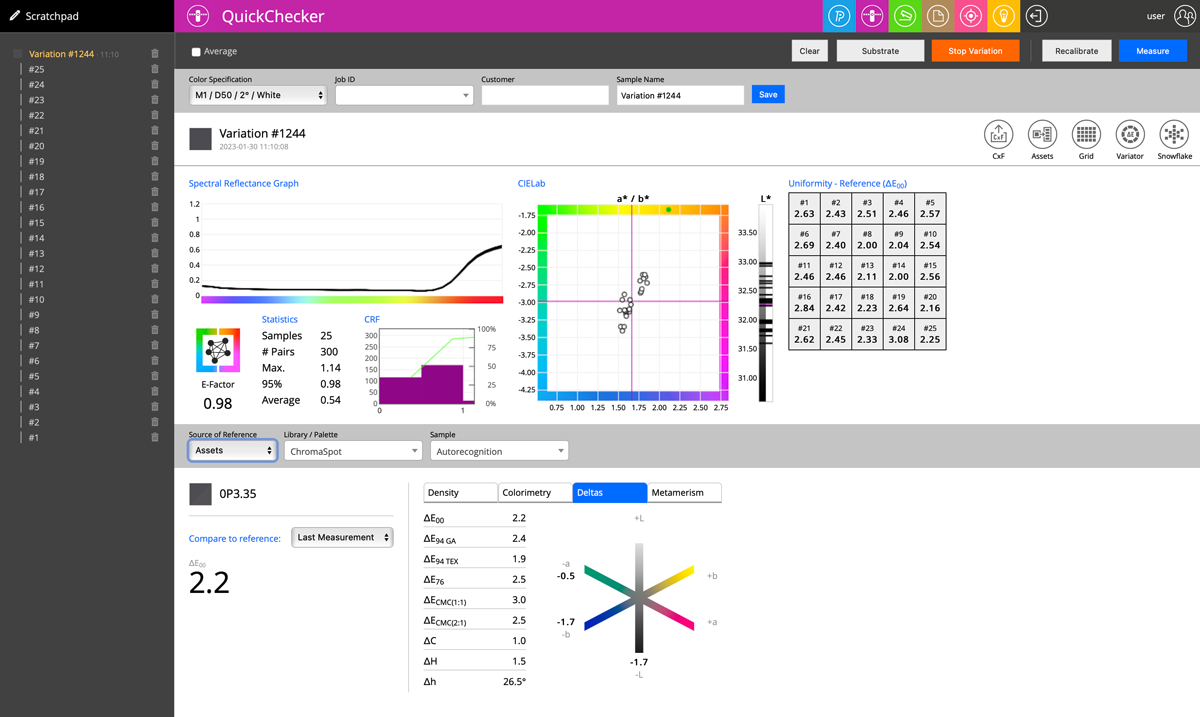
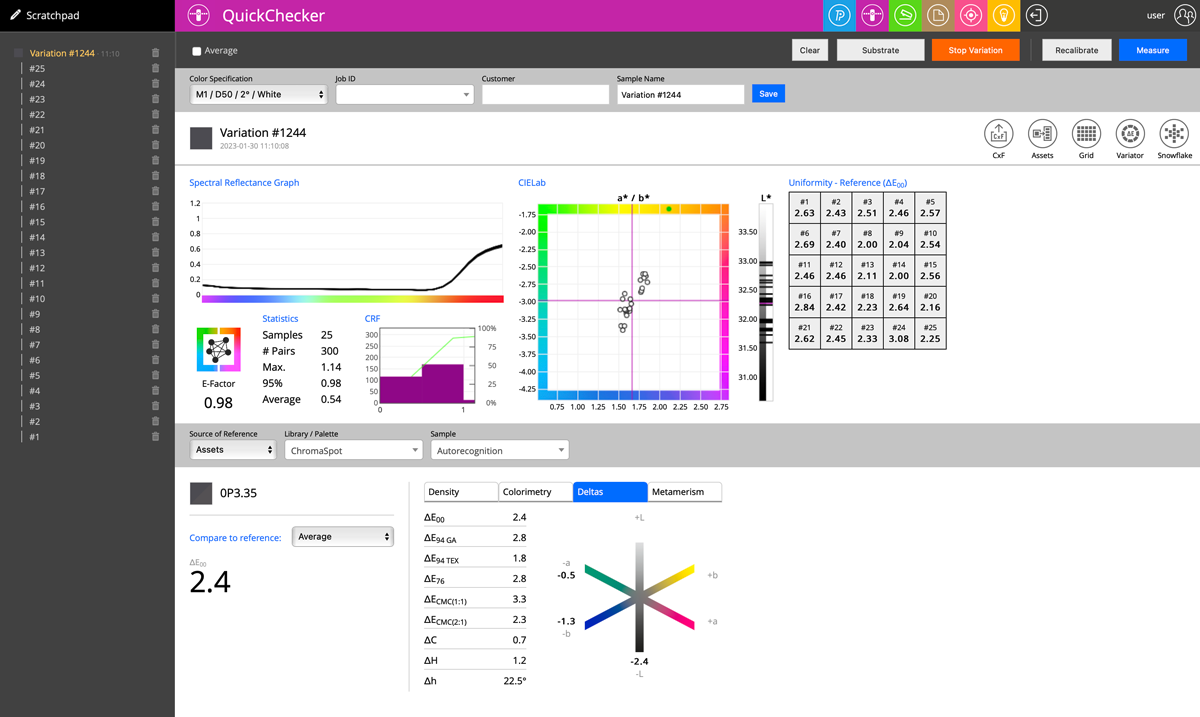
- Average:
Important notes and guidelines:
- All QuickChecker additional features are working not only for the group of measurements (Variation #...) but all individual measurements (#1, #2, ...) - until the "Stop Variation" button is pressed.
- The Operator can jump to any measurement and see details of it, can add another one, delete unwanted ones, rename any, and make comments (Description Tab)
- It is possible to change Color Specifications (select different Illuminant/Observer including Custom Lighting) at any time.
- Hover the mouse over any dort on the graph (or line on the L* ruler) to identify measurement.
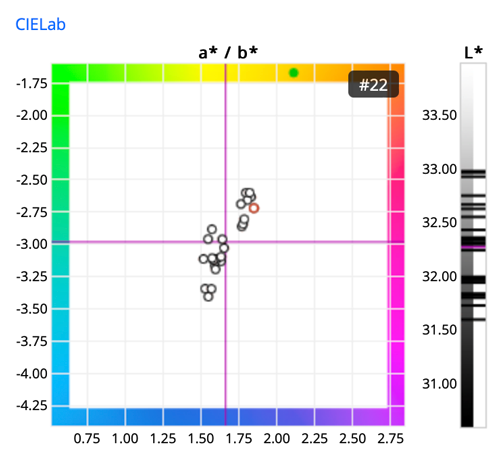
In this example, Measurement #22 is selected (marked with red)
Contact ChromaChecker Support
Additional information and Support Form is available for logged users.